29
/
en
AIzaSyAYiBZKx7MnpbEhh9jyipgxe19OcubqV5w
April 1, 2024
98129
Cabo Verde
CPV
true
2
1
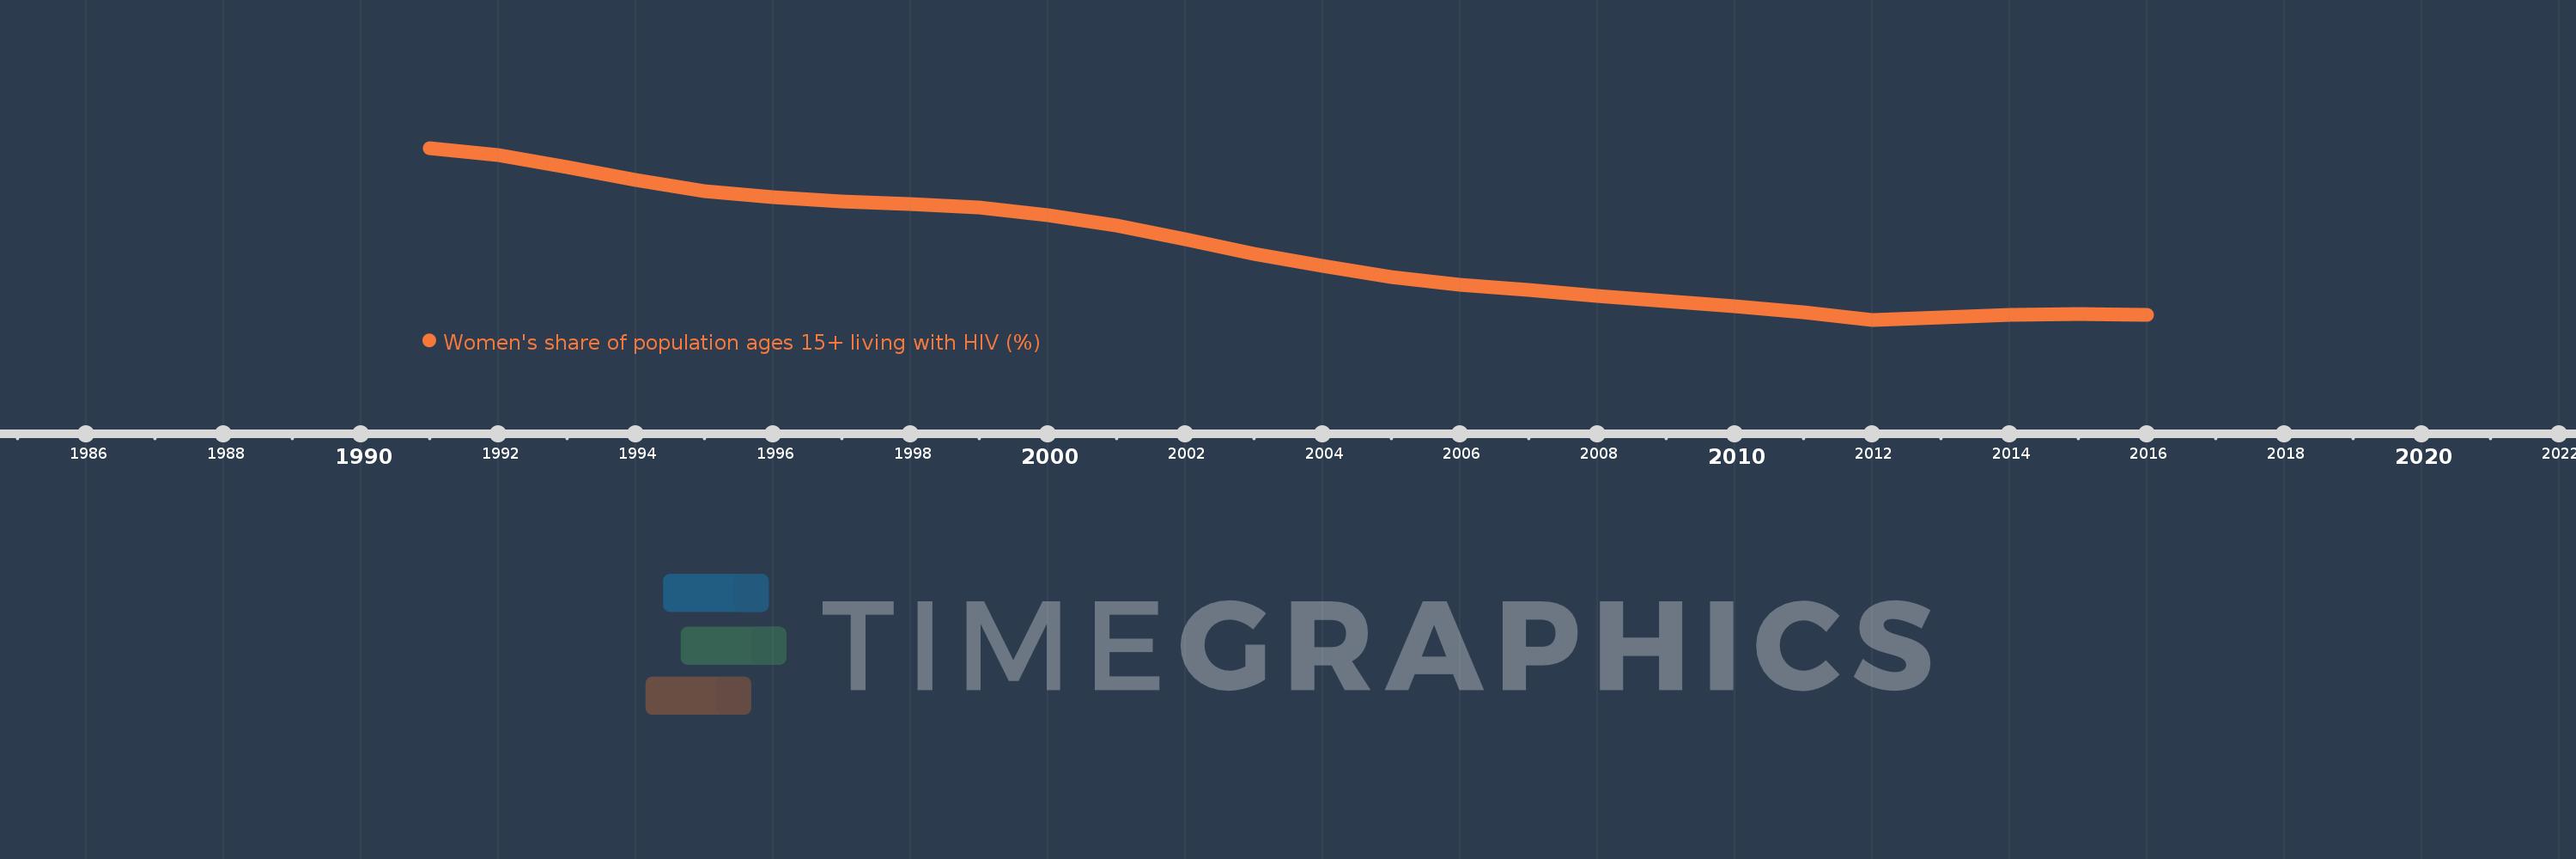
Women's share of population ages 15+ living with HIV (%)
2016,2015,2014,2013,2012,2011,2010,2009,2008,2007,2006,2005,2004,2003,2002,2001,2000,1999,1998,1997,1996,1995,1994,1993,1992,1991
This statistics in other country:
Timeline:
This timeline shows a graph from 1991 to 2016 of Cabo Verde. No data until 1990. Number of actual observations by date: 26.
Source name:
World Development Indicators
Source organization:
UNAIDS estimates.
Categories, topics:
Health, Gender
Last updated:
apr 23, 2017
Indicators value changes by year
Minimum:
54.074
jan 1, 2012
Maximum:
57.638
jan 1, 1991
At the date of observation
Value
Absolute change
Change from previous value
jan 1, 1991
57.638
+57.638
0.0%
jan 1, 1992
57.498
-0.14
-0.24%
jan 1, 1993
57.236
-0.263
-0.46%
jan 1, 1994
56.973
-0.262
-0.46%
jan 1, 1995
56.738
-0.236
-0.41%
jan 1, 1996
56.618
-0.12
-0.21%
jan 1, 1997
56.52
-0.098
-0.17%
jan 1, 1998
56.469
-0.051
-0.09%
jan 1, 1999
56.396
-0.073
-0.13%
jan 1, 2000
56.248
-0.148
-0.26%
jan 1, 2001
56.031
-0.217
-0.39%
jan 1, 2002
55.743
-0.287
-0.51%
jan 1, 2003
55.449
-0.294
-0.53%
jan 1, 2004
55.197
-0.251
-0.45%
jan 1, 2005
54.958
-0.24
-0.43%
jan 1, 2006
54.802
-0.155
-0.28%
jan 1, 2007
54.688
-0.114
-0.21%
jan 1, 2008
54.576
-0.112
-0.2%
jan 1, 2009
54.461
-0.115
-0.21%
jan 1, 2010
54.356
-0.105
-0.19%
jan 1, 2011
54.222
-0.135
-0.25%
jan 1, 2012
54.074
-0.147
-0.27%
jan 1, 2013
54.117
+0.043
0.08%
jan 1, 2014
54.182
+0.065
0.12%
jan 1, 2015
54.193
+0.011
0.02%
jan 1, 2016
54.18
-0.013
-0.02%
Ranking of countries by current statistics by years


Comments: