29
/
en
AIzaSyAYiBZKx7MnpbEhh9jyipgxe19OcubqV5w
April 1, 2024
196443
Mexico
MEX
true
2
1
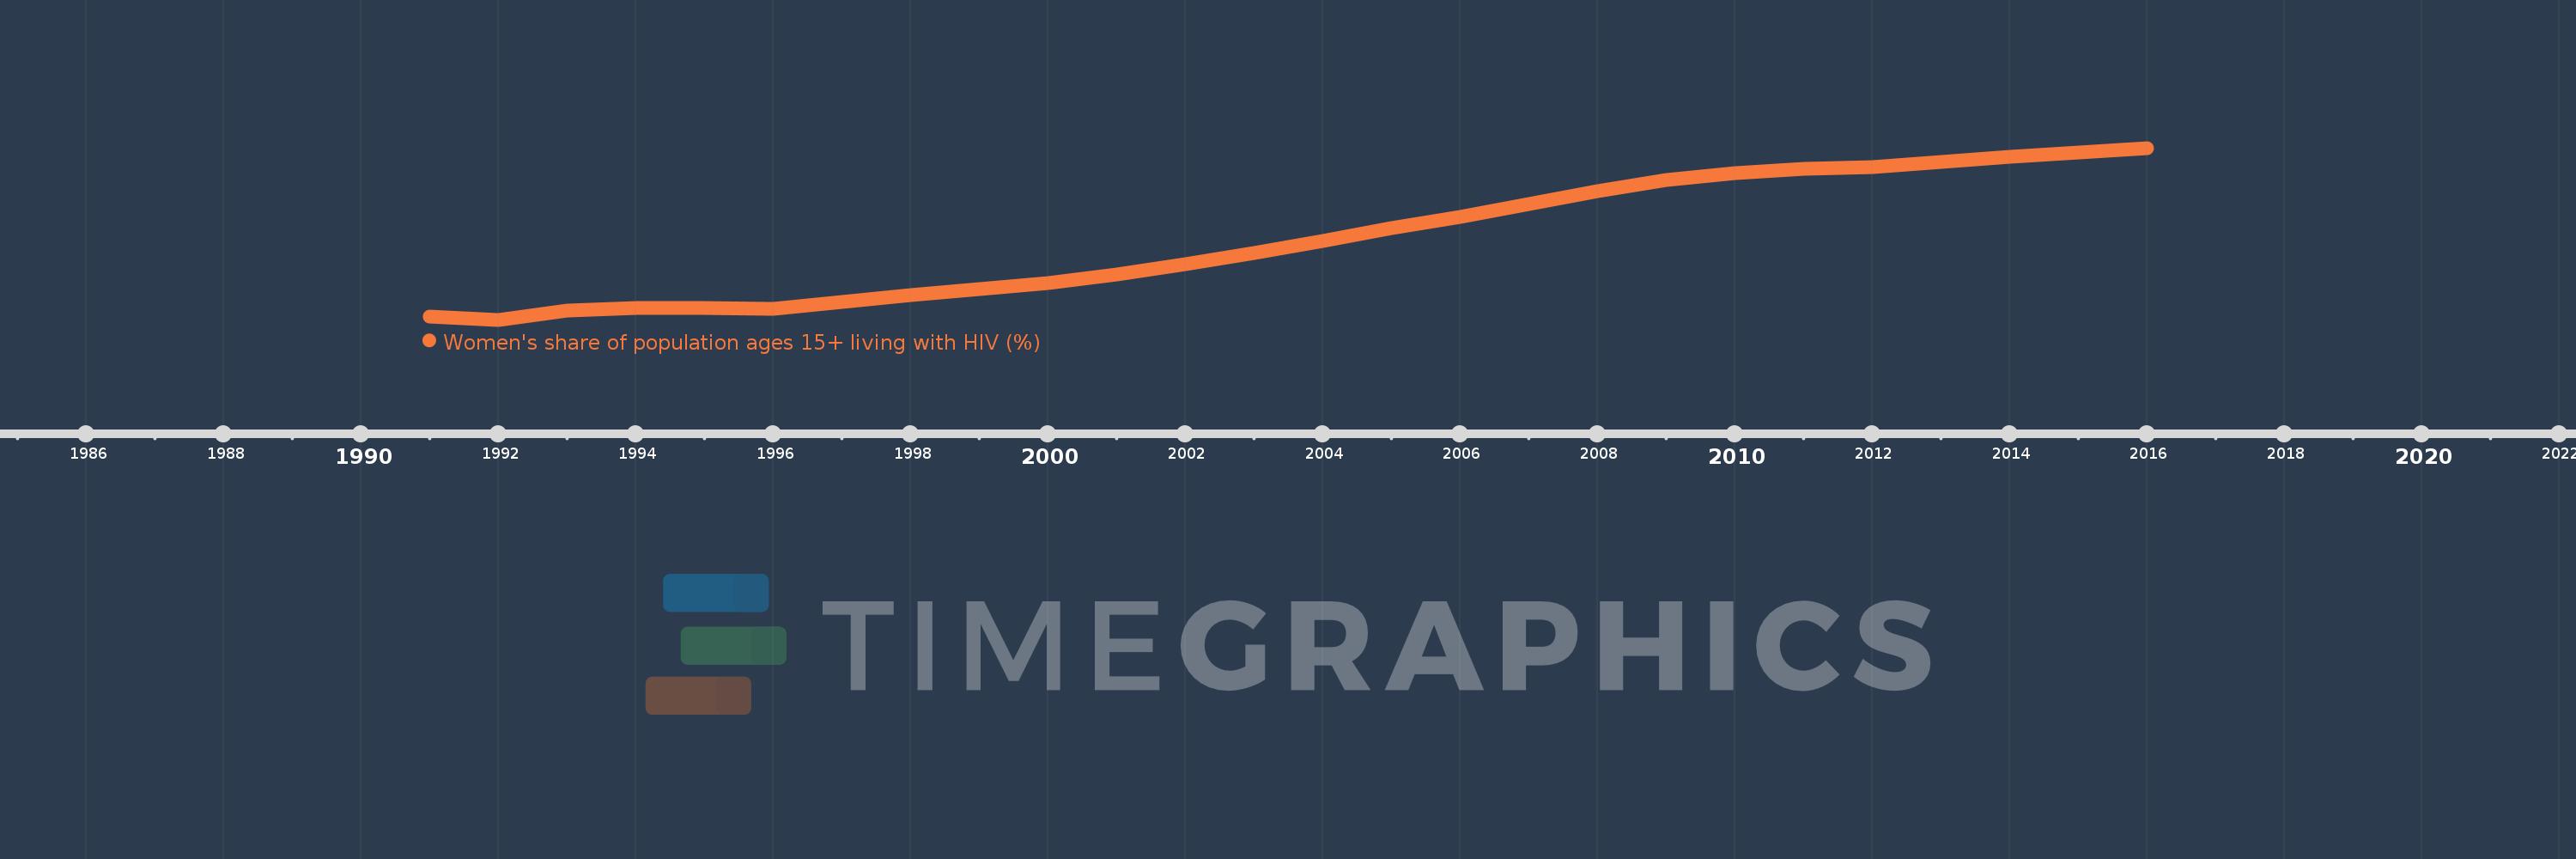
Women's share of population ages 15+ living with HIV (%)
2016,2015,2014,2013,2012,2011,2010,2009,2008,2007,2006,2005,2004,2003,2002,2001,2000,1999,1998,1997,1996,1995,1994,1993,1992,1991
This statistics in other country:
Timeline:
This timeline shows a graph from 1991 to 2016 of Mexico. No data until 1990. Number of actual observations by date: 26.
Source name:
World Development Indicators
Source organization:
UNAIDS estimates.
Categories, topics:
Health, Gender
Last updated:
apr 23, 2017
Indicators value changes by year
Minimum:
14.582
jan 1, 1992
Maximum:
20.658
jan 1, 2016
At the date of observation
Value
Absolute change
Change from previous value
jan 1, 1991
14.692
+14.692
0.0%
jan 1, 1992
14.582
-0.11
-0.75%
jan 1, 1993
14.92
+0.338
2.32%
jan 1, 1994
14.996
+0.076
0.51%
jan 1, 1995
14.987
-0.009
-0.06%
jan 1, 1996
14.979
-0.008
-0.05%
jan 1, 1997
15.222
+0.243
1.62%
jan 1, 1998
15.439
+0.217
1.43%
jan 1, 1999
15.664
+0.225
1.46%
jan 1, 2000
15.882
+0.218
1.39%
jan 1, 2001
16.185
+0.304
1.91%
jan 1, 2002
16.549
+0.363
2.25%
jan 1, 2003
16.943
+0.394
2.38%
jan 1, 2004
17.383
+0.44
2.6%
jan 1, 2005
17.82
+0.437
2.51%
jan 1, 2006
18.231
+0.411
2.3%
jan 1, 2007
18.679
+0.448
2.46%
jan 1, 2008
19.132
+0.453
2.42%
jan 1, 2009
19.534
+0.402
2.1%
jan 1, 2010
19.773
+0.239
1.22%
jan 1, 2011
19.906
+0.133
0.67%
jan 1, 2012
19.983
+0.076
0.38%
jan 1, 2013
20.164
+0.181
0.91%
jan 1, 2014
20.335
+0.171
0.85%
jan 1, 2015
20.512
+0.177
0.87%
jan 1, 2016
20.658
+0.146
0.71%
Ranking of countries by current statistics by years


Comments: