29
/
en
AIzaSyAYiBZKx7MnpbEhh9jyipgxe19OcubqV5w
April 1, 2024
211266
Nicaragua
NIC
true
2
1
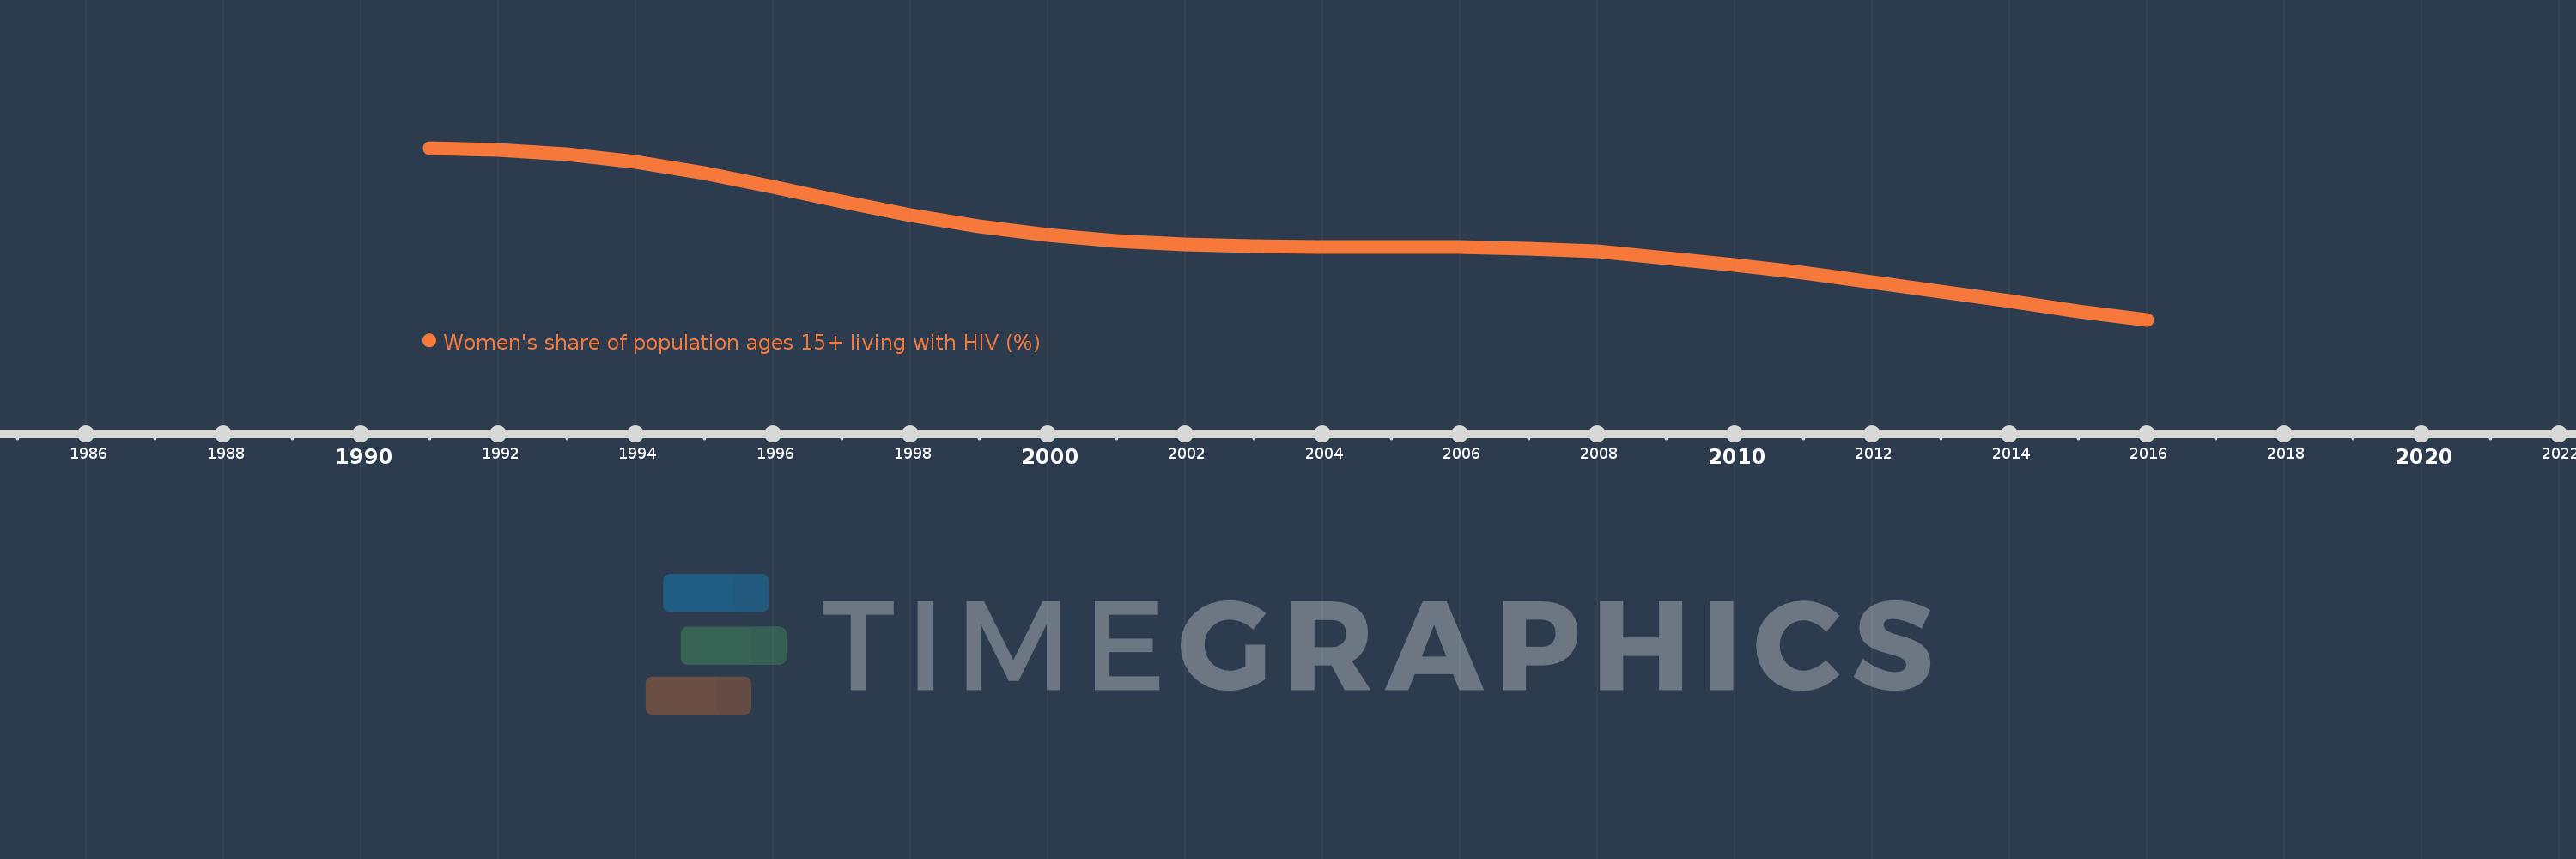
Women's share of population ages 15+ living with HIV (%)
2016,2015,2014,2013,2012,2011,2010,2009,2008,2007,2006,2005,2004,2003,2002,2001,2000,1999,1998,1997,1996,1995,1994,1993,1992,1991
This statistics in other country:
Timeline:
This timeline shows a graph from 1991 to 2016 of Nicaragua. No data until 1990. Number of actual observations by date: 26.
Source name:
World Development Indicators
Source organization:
UNAIDS estimates.
Categories, topics:
Health, Gender
Last updated:
apr 23, 2017
Indicators value changes by year
Minimum:
25.315
jan 1, 2016
At the date of observation
Value
Absolute change
Change from previous value
jan 1, 1991
52.94
+52.94
0.0%
jan 1, 1992
52.665
-0.275
-0.52%
jan 1, 1993
51.944
-0.721
-1.37%
jan 1, 1994
50.724
-1.22
-2.35%
jan 1, 1995
48.875
-1.85
-3.65%
jan 1, 1996
46.673
-2.202
-4.5%
jan 1, 1997
44.336
-2.337
-5.01%
jan 1, 1998
42.056
-2.28
-5.14%
jan 1, 1999
40.316
-1.74
-4.14%
jan 1, 2000
38.963
-1.352
-3.35%
jan 1, 2001
37.968
-0.995
-2.55%
jan 1, 2002
37.393
-0.575
-1.52%
jan 1, 2003
37.124
-0.268
-0.72%
jan 1, 2004
37.046
-0.079
-0.21%
jan 1, 2005
37.036
-0.01
-0.03%
jan 1, 2006
37.002
-0.034
-0.09%
jan 1, 2007
36.787
-0.215
-0.58%
jan 1, 2008
36.277
-0.51
-1.39%
jan 1, 2009
35.287
-0.989
-2.73%
jan 1, 2010
34.152
-1.136
-3.22%
jan 1, 2011
32.802
-1.35
-3.95%
jan 1, 2012
31.41
-1.393
-4.25%
jan 1, 2013
29.872
-1.538
-4.9%
jan 1, 2014
28.274
-1.598
-5.35%
jan 1, 2015
26.713
-1.561
-5.52%
jan 1, 2016
25.315
-1.397
-5.23%
Ranking of countries by current statistics by years


Comments: