29
/es/
es
AIzaSyAYiBZKx7MnpbEhh9jyipgxe19OcubqV5w
April 1, 2024
220369
Papua New Guinea
PNG
true
2
1
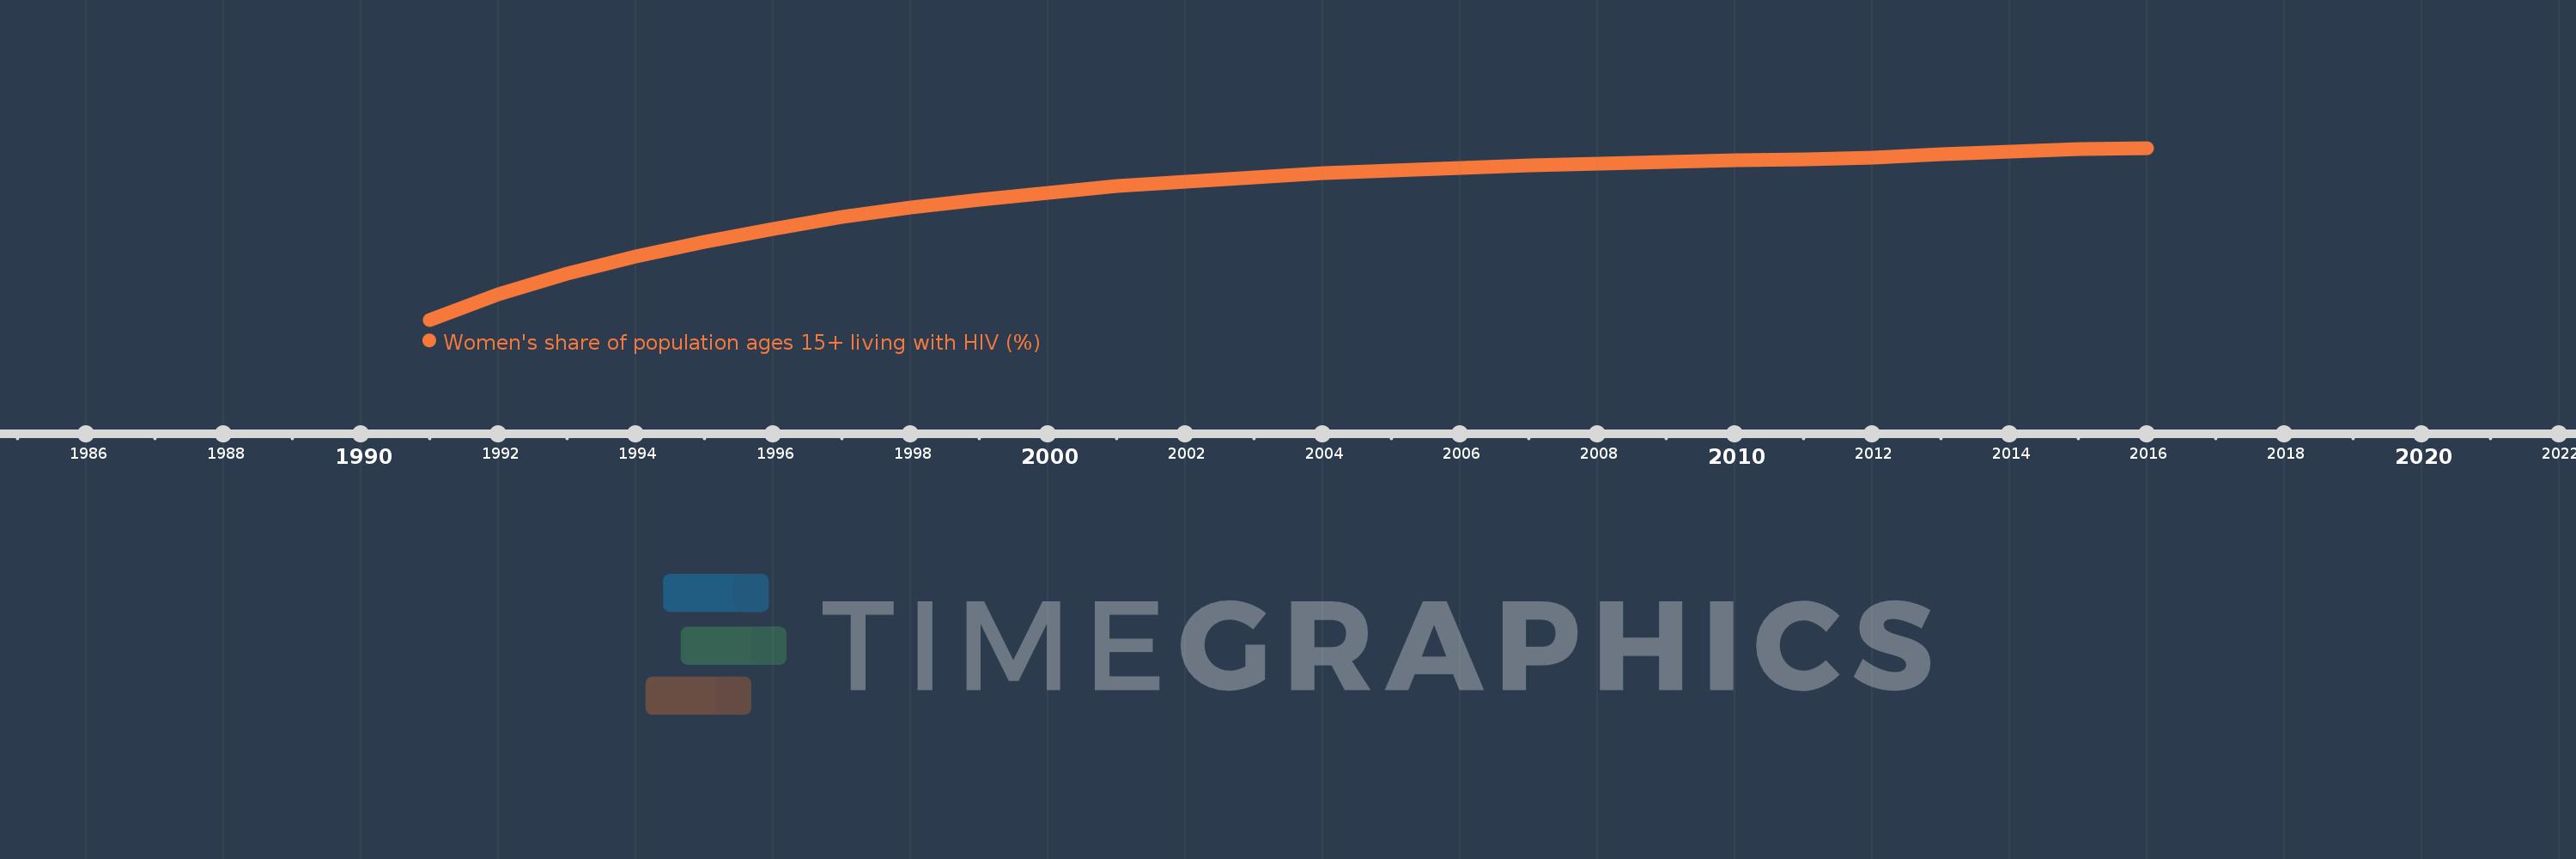
Women's share of population ages 15+ living with HIV (%)
2016,2015,2014,2013,2012,2011,2010,2009,2008,2007,2006,2005,2004,2003,2002,2001,2000,1999,1998,1997,1996,1995,1994,1993,1992,1991
Estas estadísticas en otros países:
línea de tiempo (timeline):
En esta escala de tiempo se presenta un gráfico de 1991 y 2016 de Papua New Guinea. Los datos de 1990 están ausentes. El número de observaciones reales por fecha: 26.
Fuente (nombre):
Indicadores del desarrollo mundial
Fuente (organización):
UNAIDS estimates.
Categorías:
Health, Gender
Se ha actualizado:
23 abr 2017 año
Los indicadores de los cambios de valor en los últimos años
Mínimo:
43.296
1 ene 1991 año
Máximo:
57.662
1 ene 2016 año
A la fecha de observación
Valor
Cambio absoluto
El cambio con respecto al valor anterior
1 ene 1991 año
43.296
+43.296
0.0%
1 ene 1992 año
45.425
+2.129
4.92%
1 ene 1993 año
47.153
+1.728
3.8%
1 ene 1994 año
48.597
+1.444
3.06%
1 ene 1995 año
49.834
+1.237
2.55%
1 ene 1996 año
50.924
+1.09
2.19%
1 ene 1997 año
51.864
+0.94
1.85%
1 ene 1998 año
52.655
+0.791
1.53%
1 ene 1999 año
53.345
+0.69
1.31%
1 ene 2000 año
53.928
+0.583
1.09%
1 ene 2001 año
54.453
+0.525
0.97%
1 ene 2002 año
54.869
+0.416
0.76%
1 ene 2003 año
55.223
+0.354
0.65%
1 ene 2004 año
55.527
+0.304
0.55%
1 ene 2005 año
55.783
+0.256
0.46%
1 ene 2006 año
56.008
+0.225
0.4%
1 ene 2007 año
56.205
+0.197
0.35%
1 ene 2008 año
56.369
+0.164
0.29%
1 ene 2009 año
56.497
+0.128
0.23%
1 ene 2010 año
56.606
+0.109
0.19%
1 ene 2011 año
56.719
+0.112
0.2%
1 ene 2012 año
56.886
+0.167
0.3%
1 ene 2013 año
57.148
+0.262
0.46%
1 ene 2014 año
57.376
+0.229
0.4%
1 ene 2015 año
57.541
+0.165
0.29%
1 ene 2016 año
57.662
+0.121
0.21%
Ranking de los países por los datos estadísticos actuales


Comentarios: