29
/es/
es
AIzaSyAYiBZKx7MnpbEhh9jyipgxe19OcubqV5w
April 1, 2024
63147
World
WLD
false
2
1
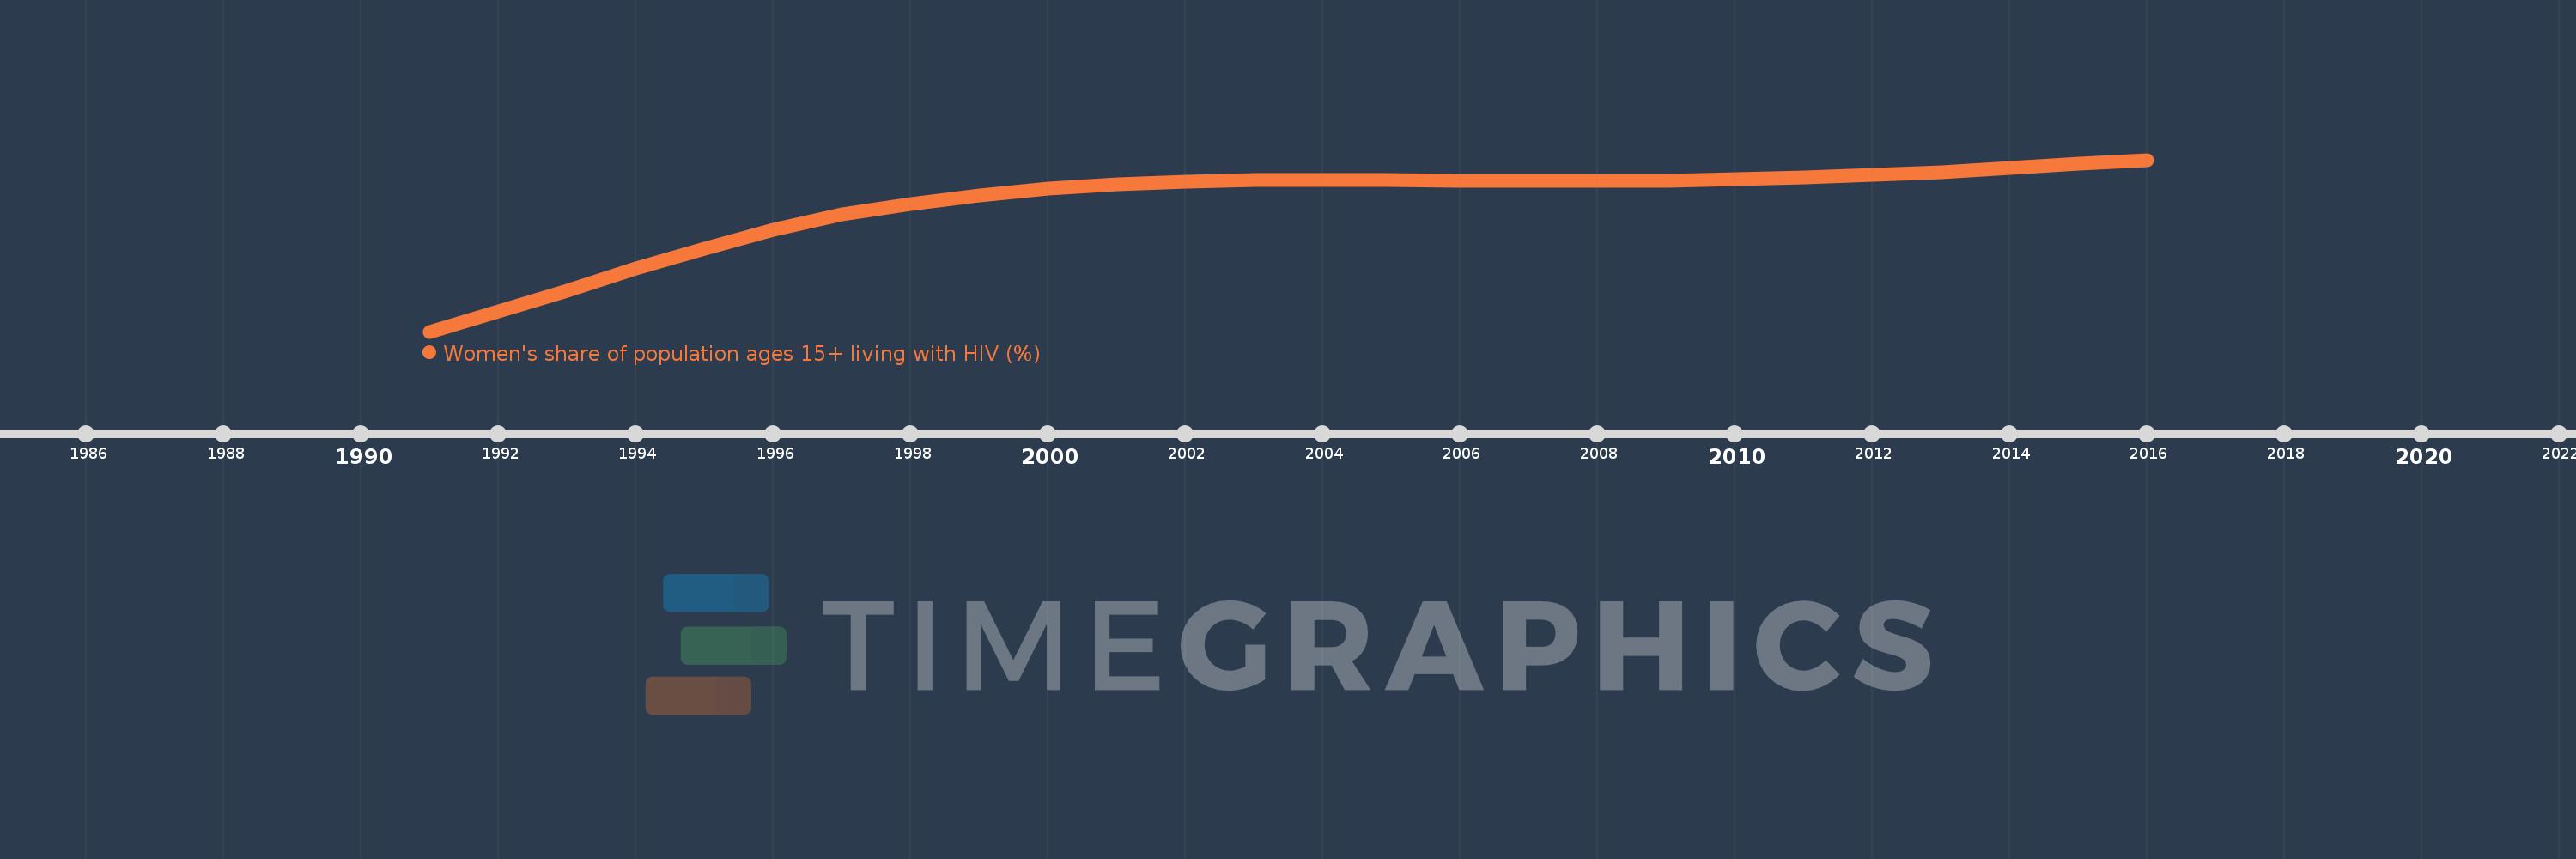
Women's share of population ages 15+ living with HIV (%)
2016,2015,2014,2013,2012,2011,2010,2009,2008,2007,2006,2005,2004,2003,2002,2001,2000,1999,1998,1997,1996,1995,1994,1993,1992,1991
Estas estadísticas en otros países:
línea de tiempo (timeline):
En esta escala de tiempo se presenta un gráfico de 1991 y 2016 de World. Los datos de 1990 están ausentes. El número de observaciones reales por fecha: 26.
Fuente (nombre):
Indicadores del desarrollo mundial
Fuente (organización):
UNAIDS estimates.
Categorías:
Health, Gender
Se ha actualizado:
23 abr 2017 año
Los indicadores de los cambios de valor en los últimos años
Mínimo:
45.091
1 ene 1991 año
Máximo:
50.836
1 ene 2016 año
A la fecha de observación
Valor
Cambio absoluto
El cambio con respecto al valor anterior
1 ene 1991 año
45.091
+45.091
0.0%
1 ene 1992 año
45.77
+0.679
1.51%
1 ene 1993 año
46.443
+0.673
1.47%
1 ene 1994 año
47.209
+0.767
1.65%
1 ene 1995 año
47.874
+0.665
1.41%
1 ene 1996 año
48.509
+0.634
1.32%
1 ene 1997 año
49.006
+0.498
1.03%
1 ene 1998 año
49.371
+0.365
0.75%
1 ene 1999 año
49.657
+0.286
0.58%
1 ene 2000 año
49.862
+0.205
0.41%
1 ene 2001 año
50.007
+0.144
0.29%
1 ene 2002 año
50.106
+0.099
0.2%
1 ene 2003 año
50.153
+0.047
0.09%
1 ene 2004 año
50.164
+0.012
0.02%
1 ene 2005 año
50.158
-0.006
-0.01%
1 ene 2006 año
50.145
-0.013
-0.03%
1 ene 2007 año
50.13
-0.014
-0.03%
1 ene 2008 año
50.121
-0.01
-0.02%
1 ene 2009 año
50.139
+0.018
0.04%
1 ene 2010 año
50.178
+0.039
0.08%
1 ene 2011 año
50.249
+0.071
0.14%
1 ene 2012 año
50.328
+0.078
0.16%
1 ene 2013 año
50.429
+0.102
0.2%
1 ene 2014 año
50.571
+0.142
0.28%
1 ene 2015 año
50.715
+0.144
0.28%
1 ene 2016 año
50.836
+0.121
0.24%
Ranking de los países por los datos estadísticos actuales


Comentarios: