29
/es/
es
AIzaSyAYiBZKx7MnpbEhh9jyipgxe19OcubqV5w
April 1, 2024
80108
Barbados
BRB
true
2
1
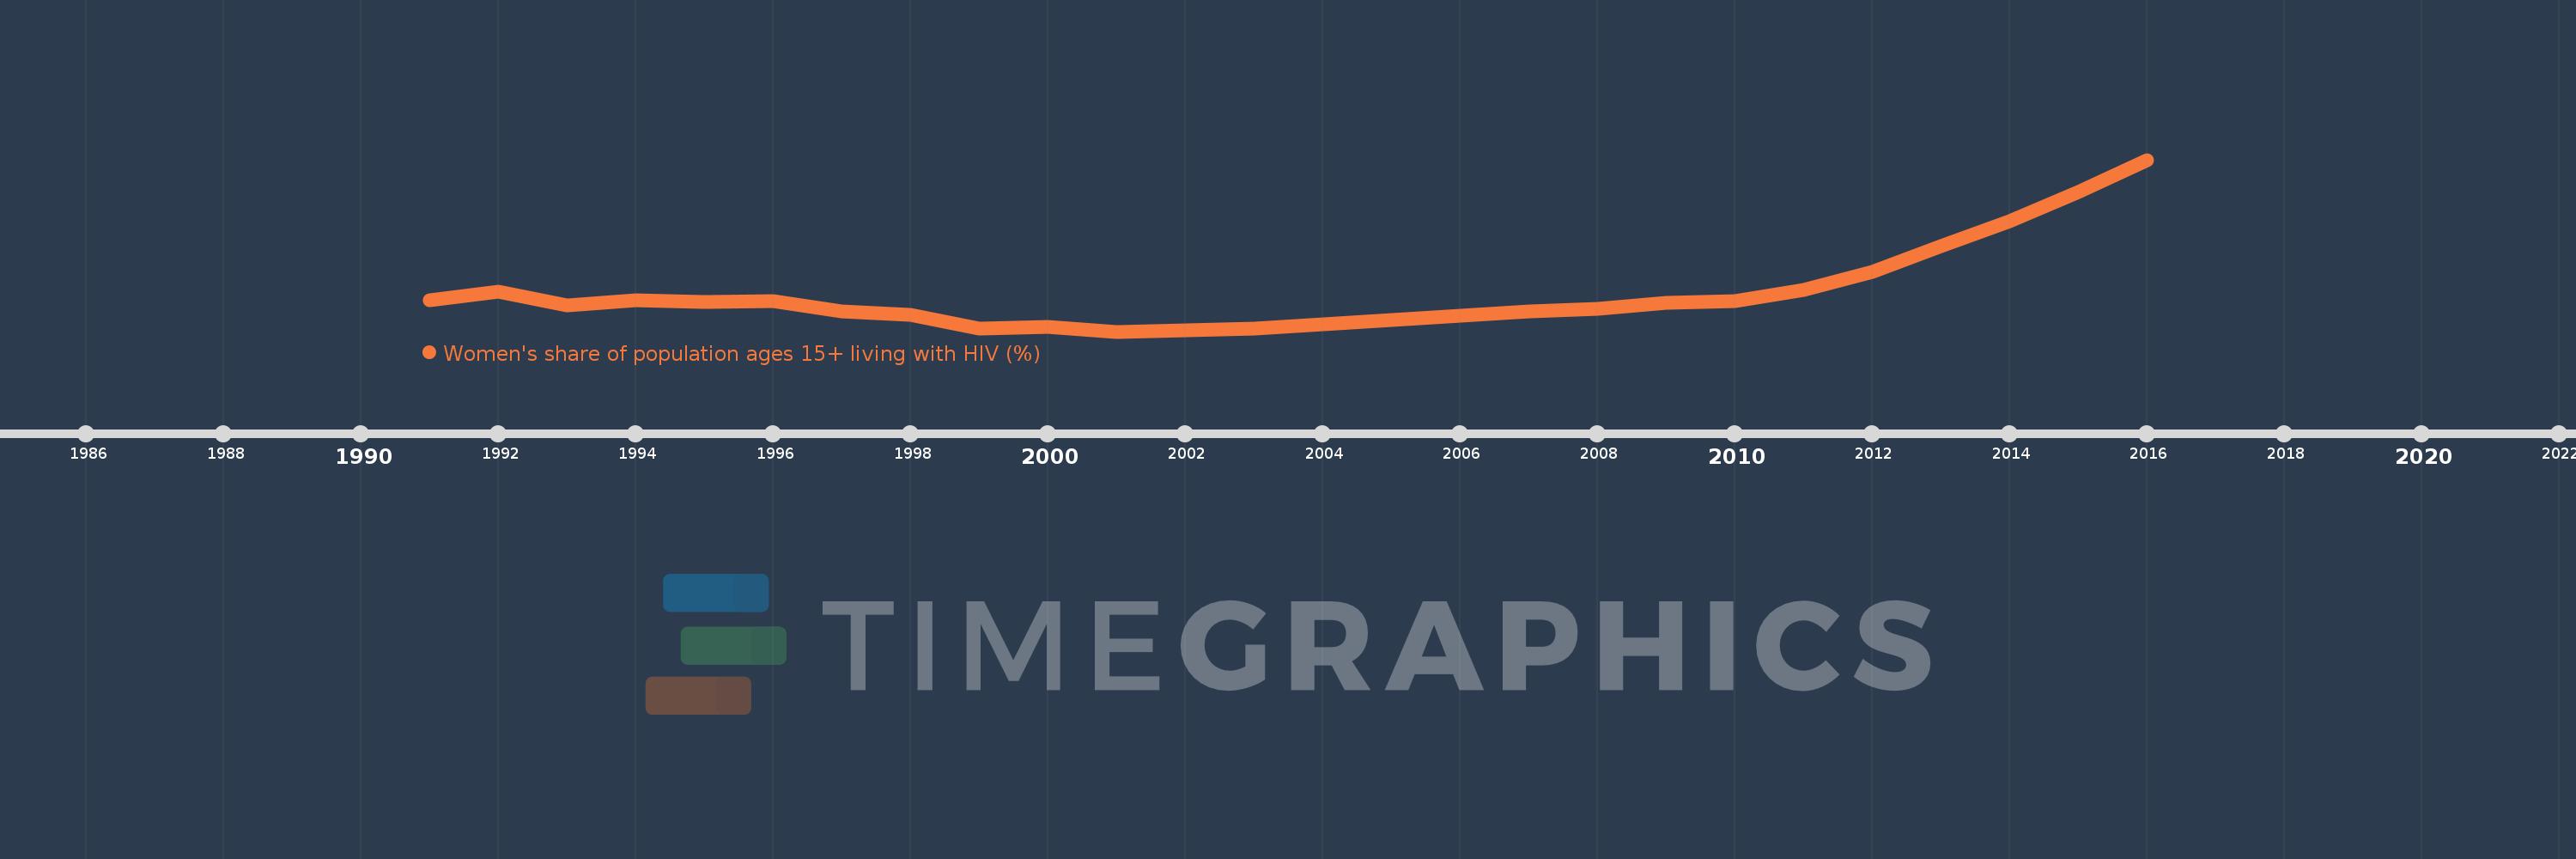
Women's share of population ages 15+ living with HIV (%)
2016,2015,2014,2013,2012,2011,2010,2009,2008,2007,2006,2005,2004,2003,2002,2001,2000,1999,1998,1997,1996,1995,1994,1993,1992,1991
Estas estadísticas en otros países:
línea de tiempo (timeline):
En esta escala de tiempo se presenta un gráfico de 1991 y 2016 de Barbados. Los datos de 1990 están ausentes. El número de observaciones reales por fecha: 26.
Fuente (nombre):
Indicadores del desarrollo mundial
Fuente (organización):
UNAIDS estimates.
Categorías:
Health, Gender
Se ha actualizado:
23 abr 2017 año
Los indicadores de los cambios de valor en los últimos años
Mínimo:
28.785
1 ene 2001 año
Máximo:
31.109
1 ene 2016 año
A la fecha de observación
Valor
Cambio absoluto
El cambio con respecto al valor anterior
1 ene 1991 año
29.204
+29.204
0.0%
1 ene 1992 año
29.329
+0.125
0.43%
1 ene 1993 año
29.143
-0.186
-0.63%
1 ene 1994 año
29.206
+0.063
0.22%
1 ene 1995 año
29.183
-0.023
-0.08%
1 ene 1996 año
29.195
+0.012
0.04%
1 ene 1997 año
29.061
-0.134
-0.46%
1 ene 1998 año
29.011
-0.05
-0.17%
1 ene 1999 año
28.83
-0.181
-0.62%
1 ene 2000 año
28.852
+0.023
0.08%
1 ene 2001 año
28.785
-0.068
-0.23%
1 ene 2002 año
28.806
+0.021
0.07%
1 ene 2003 año
28.824
+0.018
0.06%
1 ene 2004 año
28.88
+0.057
0.2%
1 ene 2005 año
28.944
+0.063
0.22%
1 ene 2006 año
28.997
+0.053
0.18%
1 ene 2007 año
29.059
+0.063
0.22%
1 ene 2008 año
29.09
+0.031
0.11%
1 ene 2009 año
29.178
+0.088
0.3%
1 ene 2010 año
29.2
+0.022
0.08%
1 ene 2011 año
29.346
+0.146
0.5%
1 ene 2012 año
29.587
+0.241
0.82%
1 ene 2013 año
29.936
+0.349
1.18%
1 ene 2014 año
30.273
+0.337
1.13%
1 ene 2015 año
30.669
+0.396
1.31%
1 ene 2016 año
31.109
+0.44
1.44%
Ranking de los países por los datos estadísticos actuales


Comentarios: