29
/es/
es
AIzaSyAYiBZKx7MnpbEhh9jyipgxe19OcubqV5w
April 1, 2024
254794
Suriname
SUR
true
2
1
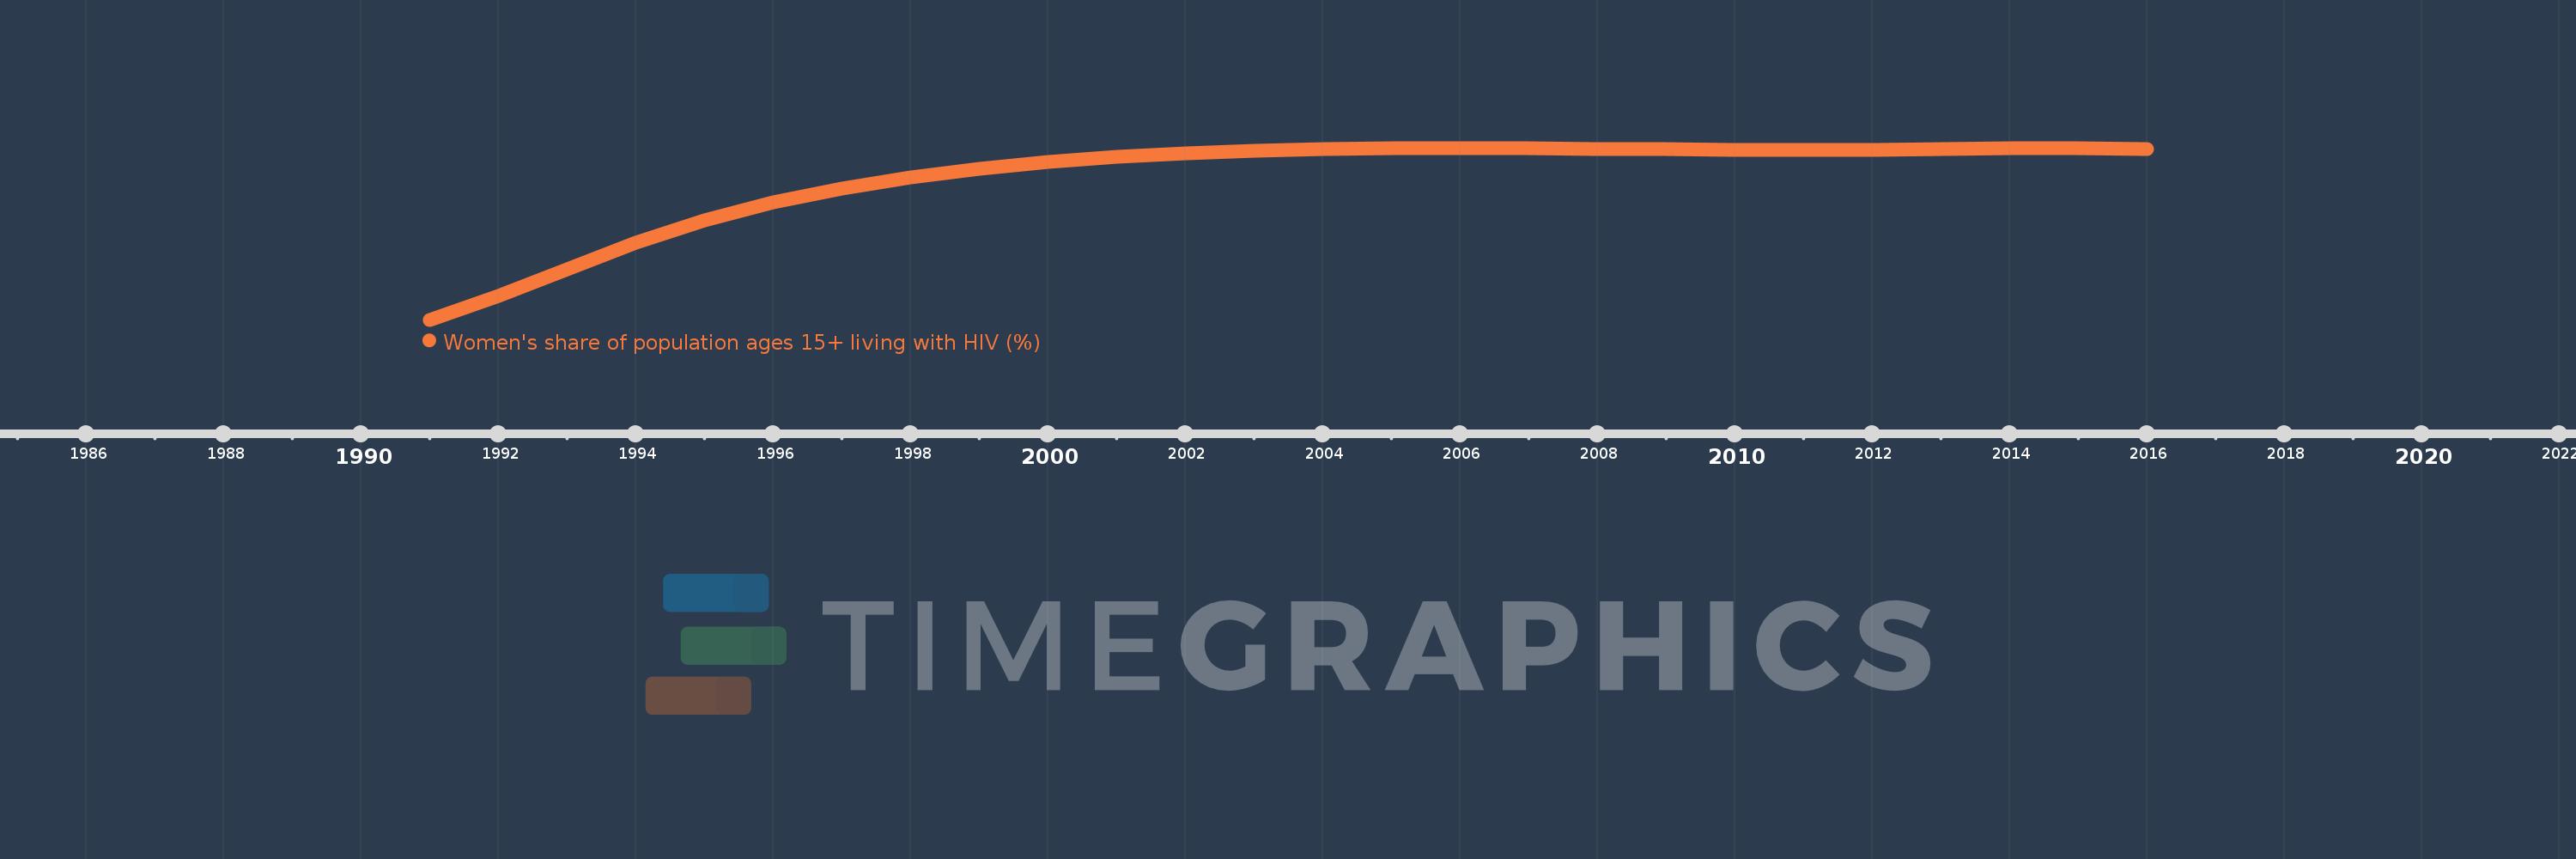
Women's share of population ages 15+ living with HIV (%)
2016,2015,2014,2013,2012,2011,2010,2009,2008,2007,2006,2005,2004,2003,2002,2001,2000,1999,1998,1997,1996,1995,1994,1993,1992,1991
Estas estadísticas en otros países:
línea de tiempo (timeline):
En esta escala de tiempo se presenta un gráfico de 1991 y 2016 de Suriname. Los datos de 1990 están ausentes. El número de observaciones reales por fecha: 26.
Fuente (nombre):
Indicadores del desarrollo mundial
Fuente (organización):
UNAIDS estimates.
Categorías:
Health, Gender
Se ha actualizado:
23 abr 2017 año
Los indicadores de los cambios de valor en los últimos años
Mínimo:
16.511
1 ene 1991 año
Máximo:
47.435
1 ene 2006 año
A la fecha de observación
Valor
Cambio absoluto
El cambio con respecto al valor anterior
1 ene 1991 año
16.511
+16.511
0.0%
1 ene 1992 año
20.776
+4.265
25.83%
1 ene 1993 año
25.601
+4.825
23.22%
1 ene 1994 año
30.327
+4.725
18.46%
1 ene 1995 año
34.366
+4.039
13.32%
1 ene 1996 año
37.618
+3.253
9.46%
1 ene 1997 año
40.064
+2.446
6.5%
1 ene 1998 año
42.166
+2.102
5.25%
1 ene 1999 año
43.747
+1.581
3.75%
1 ene 2000 año
44.917
+1.17
2.67%
1 ene 2001 año
45.801
+0.884
1.97%
1 ene 2002 año
46.452
+0.65
1.42%
1 ene 2003 año
46.92
+0.469
1.01%
1 ene 2004 año
47.262
+0.342
0.73%
1 ene 2005 año
47.403
+0.141
0.3%
1 ene 2006 año
47.435
+0.032
0.07%
1 ene 2007 año
47.344
-0.091
-0.19%
1 ene 2008 año
47.275
-0.069
-0.15%
1 ene 2009 año
47.199
-0.076
-0.16%
1 ene 2010 año
47.113
-0.085
-0.18%
1 ene 2011 año
47.017
-0.096
-0.2%
1 ene 2012 año
47.041
+0.024
0.05%
1 ene 2013 año
47.227
+0.185
0.39%
1 ene 2014 año
47.376
+0.149
0.32%
1 ene 2015 año
47.358
-0.017
-0.04%
1 ene 2016 año
47.295
-0.063
-0.13%
Ranking de los países por los datos estadísticos actuales


Comentarios: