29
/es/
es
AIzaSyAYiBZKx7MnpbEhh9jyipgxe19OcubqV5w
April 1, 2024
81414
Belarus
BLR
true
2
1
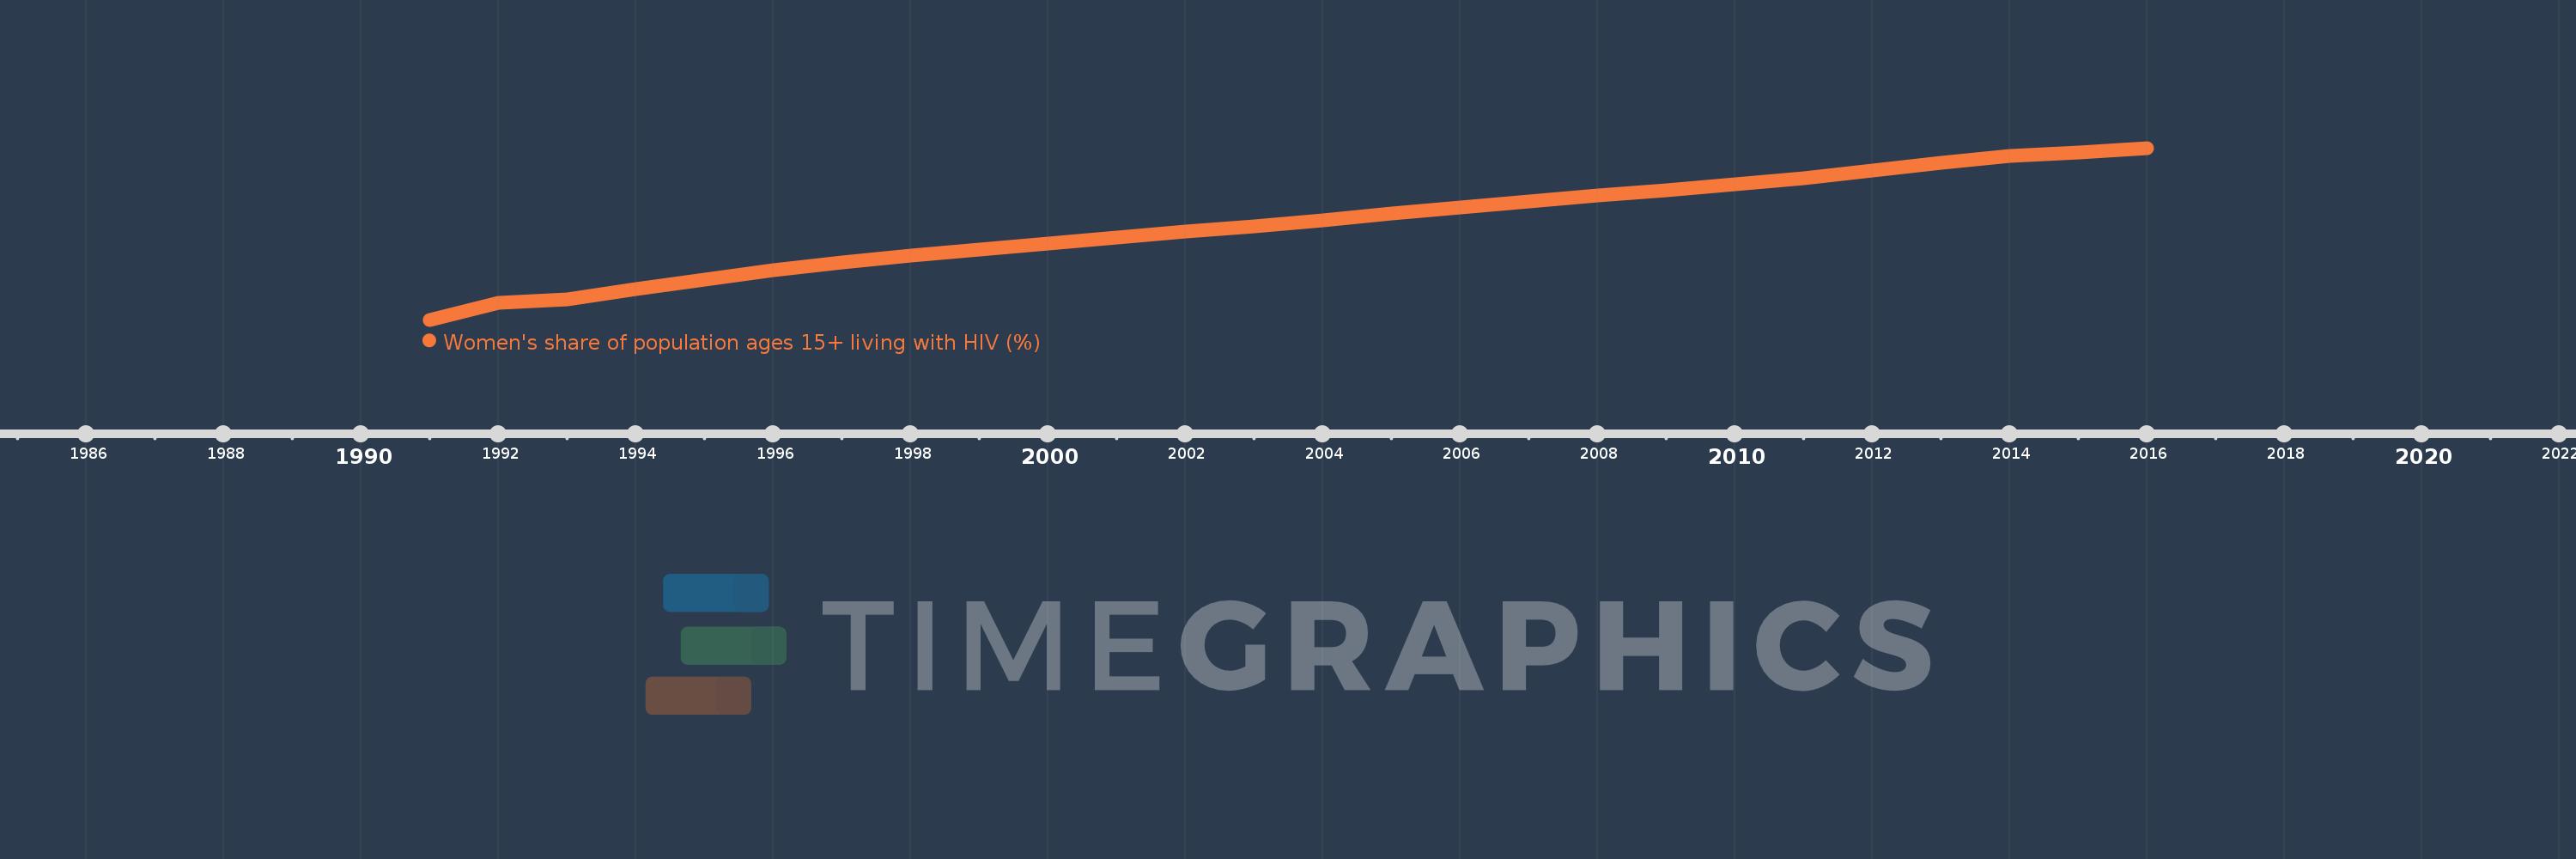
Women's share of population ages 15+ living with HIV (%)
2016,2015,2014,2013,2012,2011,2010,2009,2008,2007,2006,2005,2004,2003,2002,2001,2000,1999,1998,1997,1996,1995,1994,1993,1992,1991
Estas estadísticas en otros países:
línea de tiempo (timeline):
En esta escala de tiempo se presenta un gráfico de 1991 y 2016 de Belarus. Los datos de 1990 están ausentes. El número de observaciones reales por fecha: 26.
Fuente (nombre):
Indicadores del desarrollo mundial
Fuente (organización):
UNAIDS estimates.
Categorías:
Health, Gender
Se ha actualizado:
23 abr 2017 año
Los indicadores de los cambios de valor en los últimos años
Mínimo:
28.0
1 ene 1991 año
Máximo:
44.683
1 ene 2016 año
A la fecha de observación
Valor
Cambio absoluto
El cambio con respecto al valor anterior
1 ene 1991 año
28.0
+28.0
0.0%
1 ene 1992 año
29.63
+1.63
5.82%
1 ene 1993 año
30.0
+0.37
1.25%
1 ene 1994 año
30.952
+0.952
3.17%
1 ene 1995 año
31.888
+0.935
3.02%
1 ene 1996 año
32.808
+0.92
2.89%
1 ene 1997 año
33.558
+0.75
2.29%
1 ene 1998 año
34.231
+0.673
2.01%
1 ene 1999 año
34.855
+0.624
1.82%
1 ene 2000 año
35.427
+0.572
1.64%
1 ene 2001 año
35.994
+0.567
1.6%
1 ene 2002 año
36.536
+0.543
1.51%
1 ene 2003 año
37.103
+0.567
1.55%
1 ene 2004 año
37.677
+0.574
1.55%
1 ene 2005 año
38.281
+0.604
1.6%
1 ene 2006 año
38.893
+0.612
1.6%
1 ene 2007 año
39.495
+0.601
1.55%
1 ene 2008 año
40.034
+0.539
1.37%
1 ene 2009 año
40.58
+0.546
1.36%
1 ene 2010 año
41.156
+0.576
1.42%
1 ene 2011 año
41.747
+0.592
1.44%
1 ene 2012 año
42.521
+0.774
1.85%
1 ene 2013 año
43.268
+0.747
1.76%
1 ene 2014 año
43.913
+0.645
1.49%
1 ene 2015 año
44.263
+0.35
0.8%
1 ene 2016 año
44.683
+0.419
0.95%
Ranking de los países por los datos estadísticos actuales


Comentarios: