29
/es/
es
AIzaSyAYiBZKx7MnpbEhh9jyipgxe19OcubqV5w
April 1, 2024
151286
Honduras
HND
true
2
1
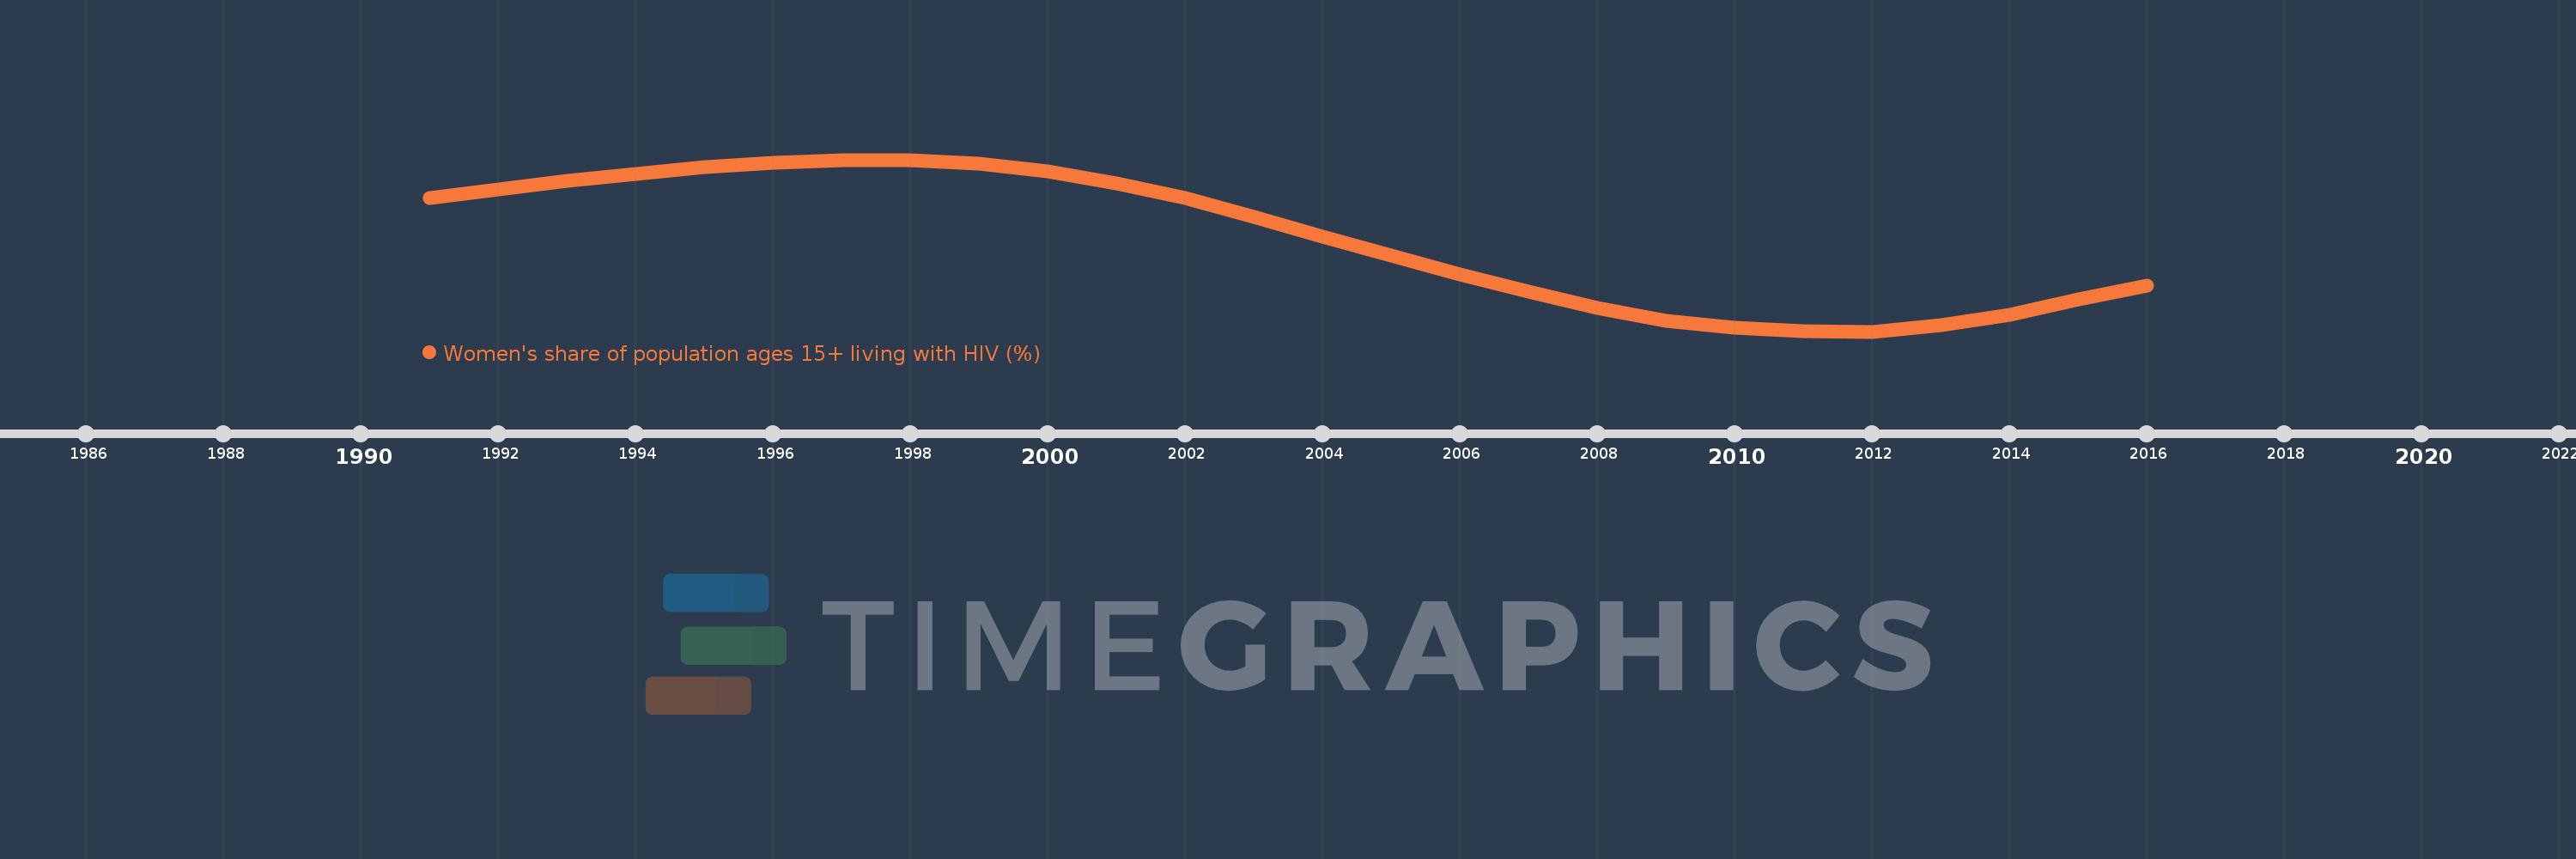
Women's share of population ages 15+ living with HIV (%)
2016,2015,2014,2013,2012,2011,2010,2009,2008,2007,2006,2005,2004,2003,2002,2001,2000,1999,1998,1997,1996,1995,1994,1993,1992,1991
Estas estadísticas en otros países:
línea de tiempo (timeline):
En esta escala de tiempo se presenta un gráfico de 1991 y 2016 de Honduras. Los datos de 1990 están ausentes. El número de observaciones reales por fecha: 26.
Fuente (nombre):
Indicadores del desarrollo mundial
Fuente (organización):
UNAIDS estimates.
Categorías:
Health, Gender
Se ha actualizado:
23 abr 2017 año
Los indicadores de los cambios de valor en los últimos años
Mínimo:
41.835
1 ene 2012 año
Máximo:
49.971
1 ene 1997 año
A la fecha de observación
Valor
Cambio absoluto
El cambio con respecto al valor anterior
1 ene 1991 año
48.144
+48.144
0.0%
1 ene 1992 año
48.569
+0.425
0.88%
1 ene 1993 año
48.958
+0.389
0.8%
1 ene 1994 año
49.314
+0.357
0.73%
1 ene 1995 año
49.612
+0.298
0.6%
1 ene 1996 año
49.843
+0.231
0.47%
1 ene 1997 año
49.971
+0.128
0.26%
1 ene 1998 año
49.958
-0.013
-0.03%
1 ene 1999 año
49.773
-0.185
-0.37%
1 ene 2000 año
49.411
-0.363
-0.73%
1 ene 2001 año
48.866
-0.545
-1.1%
1 ene 2002 año
48.149
-0.717
-1.47%
1 ene 2003 año
47.275
-0.874
-1.81%
1 ene 2004 año
46.311
-0.964
-2.04%
1 ene 2005 año
45.446
-0.865
-1.87%
1 ene 2006 año
44.549
-0.898
-1.97%
1 ene 2007 año
43.728
-0.82
-1.84%
1 ene 2008 año
42.951
-0.777
-1.78%
1 ene 2009 año
42.359
-0.592
-1.38%
1 ene 2010 año
42.004
-0.356
-0.84%
1 ene 2011 año
41.847
-0.157
-0.37%
1 ene 2012 año
41.835
-0.012
-0.03%
1 ene 2013 año
42.12
+0.284
0.68%
1 ene 2014 año
42.648
+0.529
1.26%
1 ene 2015 año
43.343
+0.694
1.63%
1 ene 2016 año
44.007
+0.664
1.53%
Ranking de los países por los datos estadísticos actuales


Comentarios: