29
/fr/
fr
AIzaSyAYiBZKx7MnpbEhh9jyipgxe19OcubqV5w
April 1, 2024
151286
Honduras
HND
true
2
1
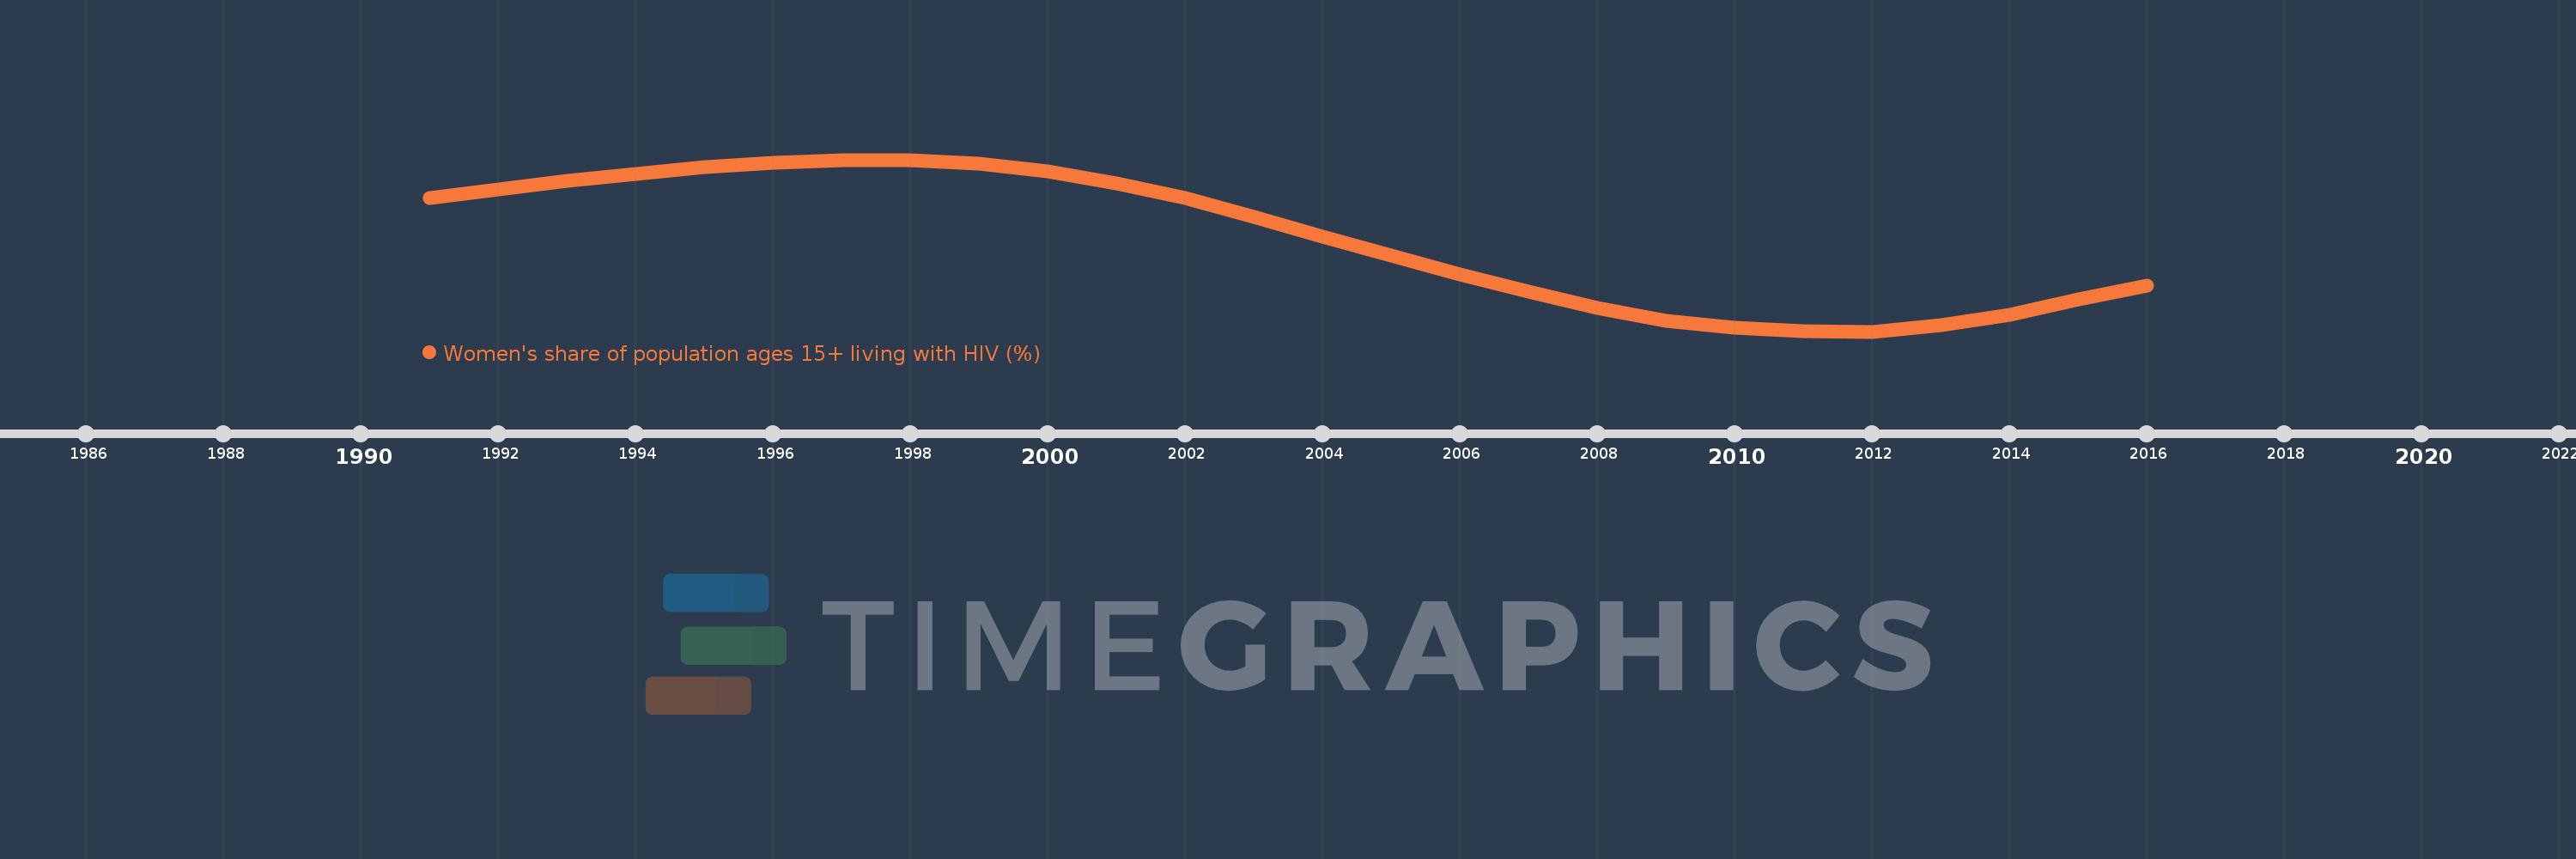
Women's share of population ages 15+ living with HIV (%)
2016,2015,2014,2013,2012,2011,2010,2009,2008,2007,2006,2005,2004,2003,2002,2001,2000,1999,1998,1997,1996,1995,1994,1993,1992,1991
Cette statistique dans les autres pays:
La ligne de temps
Cette échelle de temps montre un graphique de 1991 année à 2016 année Honduras. Les données jusqu'à 1990 année ne sont pas présentés. Quantité d'observations actuelles selon dates: 26.
Source (désignation):
Les indicateurs du développement mondiale
Source (organisation):
UNAIDS estimates.
Catégories:
Health, Gender
Dernière mise à jour
23 avr. 2017
Les indicateurs de changement de valeurs selon les années
Minimum:
41.835
1 janv. 2012
Maximum:
49.971
1 janv. 1997
Pour la date d''observation
Valeur
Changement absolu
Le changement par rapport à la valeur précédente
1 janv. 1991
48.144
+48.144
0.0%
1 janv. 1992
48.569
+0.425
0.88%
1 janv. 1993
48.958
+0.389
0.8%
1 janv. 1994
49.314
+0.357
0.73%
1 janv. 1995
49.612
+0.298
0.6%
1 janv. 1996
49.843
+0.231
0.47%
1 janv. 1997
49.971
+0.128
0.26%
1 janv. 1998
49.958
-0.013
-0.03%
1 janv. 1999
49.773
-0.185
-0.37%
1 janv. 2000
49.411
-0.363
-0.73%
1 janv. 2001
48.866
-0.545
-1.1%
1 janv. 2002
48.149
-0.717
-1.47%
1 janv. 2003
47.275
-0.874
-1.81%
1 janv. 2004
46.311
-0.964
-2.04%
1 janv. 2005
45.446
-0.865
-1.87%
1 janv. 2006
44.549
-0.898
-1.97%
1 janv. 2007
43.728
-0.82
-1.84%
1 janv. 2008
42.951
-0.777
-1.78%
1 janv. 2009
42.359
-0.592
-1.38%
1 janv. 2010
42.004
-0.356
-0.84%
1 janv. 2011
41.847
-0.157
-0.37%
1 janv. 2012
41.835
-0.012
-0.03%
1 janv. 2013
42.12
+0.284
0.68%
1 janv. 2014
42.648
+0.529
1.26%
1 janv. 2015
43.343
+0.694
1.63%
1 janv. 2016
44.007
+0.664
1.53%
Classement des pays selon les statistiques actuelles par années


Commentaires: