29
/fr/
fr
AIzaSyAYiBZKx7MnpbEhh9jyipgxe19OcubqV5w
April 1, 2024
79131
Bangladesh
BGD
true
2
1
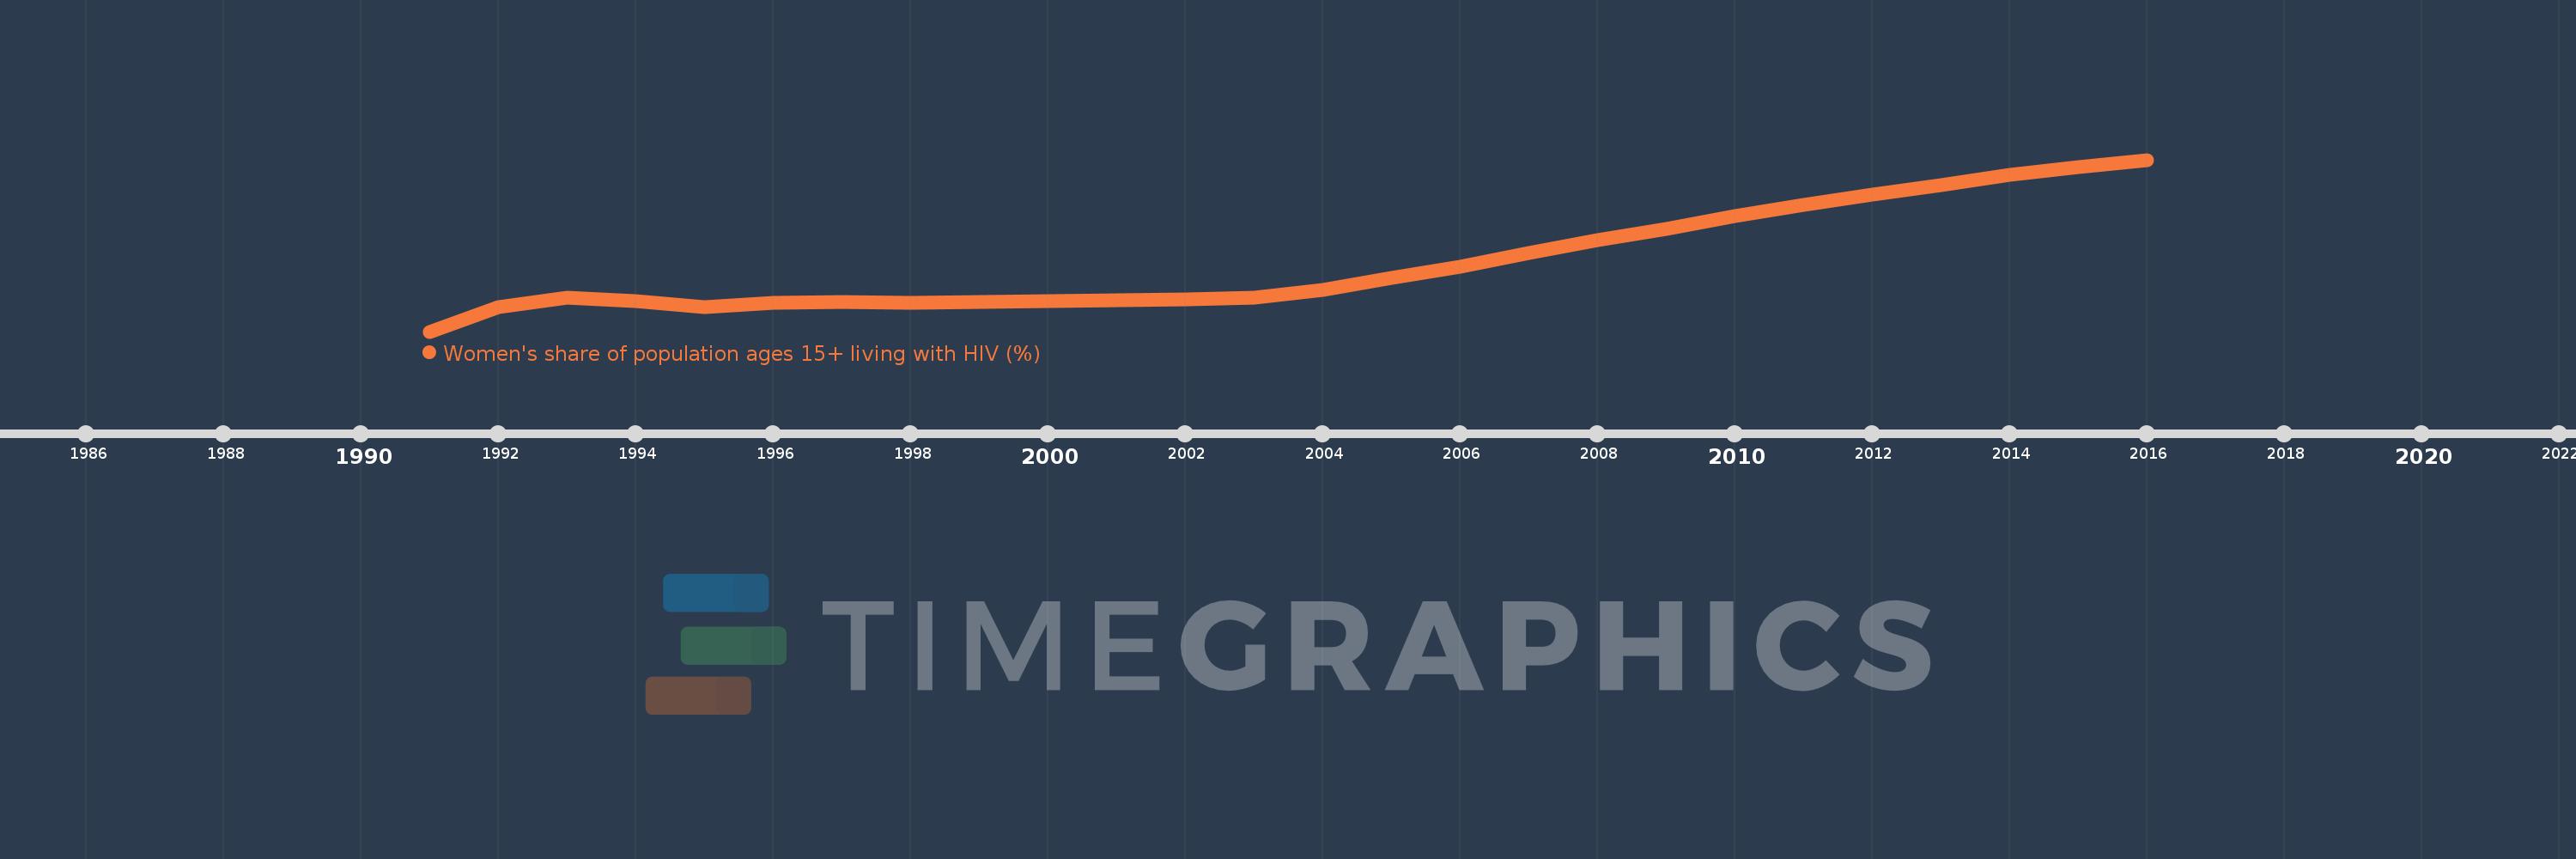
Women's share of population ages 15+ living with HIV (%)
2016,2015,2014,2013,2012,2011,2010,2009,2008,2007,2006,2005,2004,2003,2002,2001,2000,1999,1998,1997,1996,1995,1994,1993,1992,1991
Cette statistique dans les autres pays:
La ligne de temps
Cette échelle de temps montre un graphique de 1991 année à 2016 année Bangladesh. Les données jusqu'à 1990 année ne sont pas présentés. Quantité d'observations actuelles selon dates: 26.
Source (désignation):
Les indicateurs du développement mondiale
Source (organisation):
UNAIDS estimates.
Catégories:
Health, Gender
Dernière mise à jour
23 avr. 2017
Les indicateurs de changement de valeurs selon les années
Minimum:
17.647
1 janv. 1991
Maximum:
33.958
1 janv. 2016
Pour la date d''observation
Valeur
Changement absolu
Le changement par rapport à la valeur précédente
1 janv. 1991
17.647
+17.647
0.0%
1 janv. 1992
20.0
+2.353
13.33%
1 janv. 1993
20.833
+0.833
4.17%
1 janv. 1994
20.548
-0.285
-1.37%
1 janv. 1995
20.0
-0.548
-2.67%
1 janv. 1996
20.37
+0.37
1.85%
1 janv. 1997
20.426
+0.055
0.27%
1 janv. 1998
20.349
-0.077
-0.38%
1 janv. 1999
20.482
+0.133
0.65%
1 janv. 2000
20.527
+0.045
0.22%
1 janv. 2001
20.617
+0.09
0.44%
1 janv. 2002
20.678
+0.061
0.3%
1 janv. 2003
20.892
+0.214
1.03%
1 janv. 2004
21.611
+0.719
3.44%
1 janv. 2005
22.706
+1.096
5.07%
1 janv. 2006
23.804
+1.098
4.83%
1 janv. 2007
25.104
+1.3
5.46%
1 janv. 2008
26.328
+1.223
4.87%
1 janv. 2009
27.395
+1.067
4.05%
1 janv. 2010
28.629
+1.234
4.5%
1 janv. 2011
29.712
+1.083
3.78%
1 janv. 2012
30.68
+0.968
3.26%
1 janv. 2013
31.57
+0.89
2.9%
1 janv. 2014
32.492
+0.922
2.92%
1 janv. 2015
33.279
+0.787
2.42%
1 janv. 2016
33.958
+0.678
2.04%
Classement des pays selon les statistiques actuelles par années


Commentaires: