29
/fr/
fr
AIzaSyAYiBZKx7MnpbEhh9jyipgxe19OcubqV5w
April 1, 2024
195092
Mauritius
MUS
true
2
1
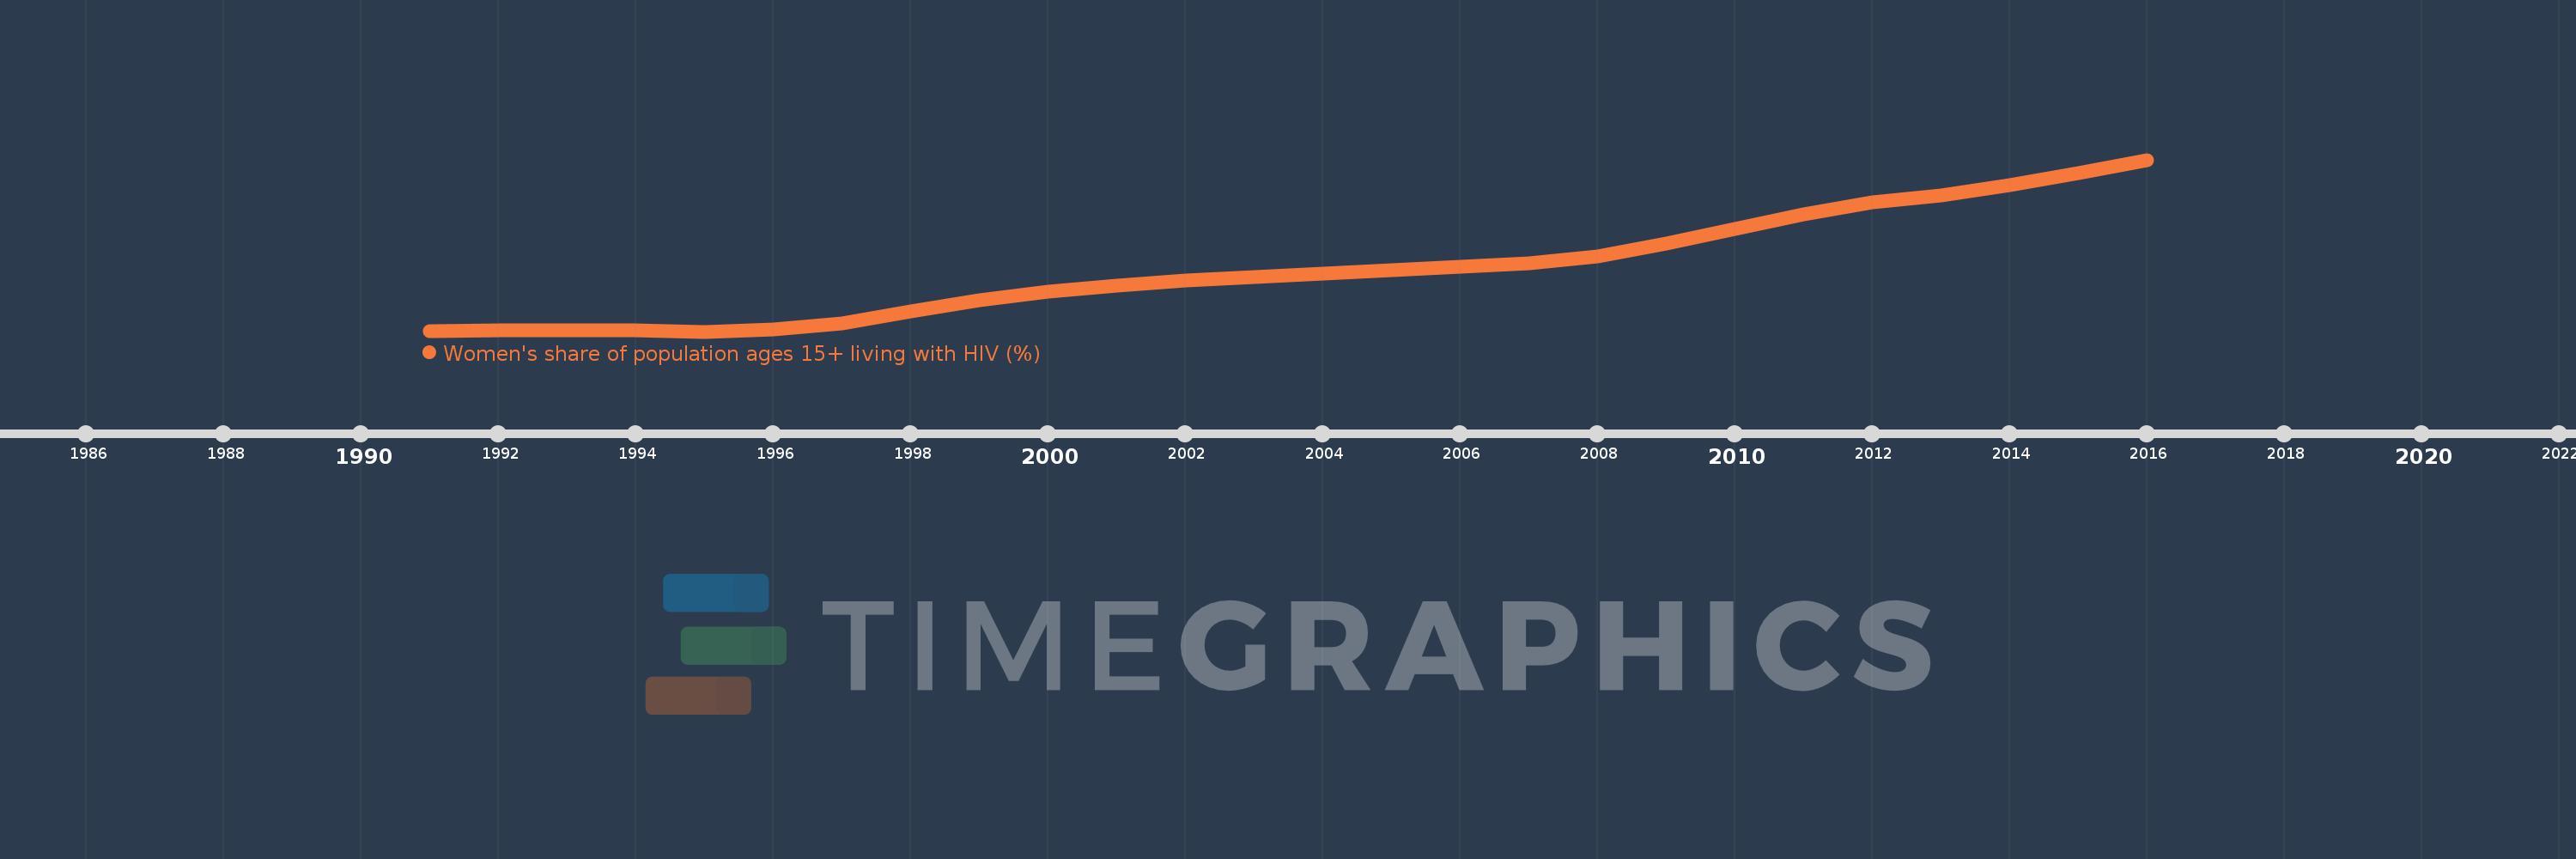
Women's share of population ages 15+ living with HIV (%)
2016,2015,2014,2013,2012,2011,2010,2009,2008,2007,2006,2005,2004,2003,2002,2001,2000,1999,1998,1997,1996,1995,1994,1993,1992,1991
Cette statistique dans les autres pays:
La ligne de temps
Cette échelle de temps montre un graphique de 1991 année à 2016 année Mauritius. Les données jusqu'à 1990 année ne sont pas présentés. Quantité d'observations actuelles selon dates: 26.
Source (désignation):
Les indicateurs du développement mondiale
Source (organisation):
UNAIDS estimates.
Catégories:
Health, Gender
Dernière mise à jour
23 avr. 2017
Les indicateurs de changement de valeurs selon les années
Minimum:
16.655
1 janv. 1995
Maximum:
25.031
1 janv. 2016
Pour la date d''observation
Valeur
Changement absolu
Le changement par rapport à la valeur précédente
1 janv. 1991
16.667
+16.667
0.0%
1 janv. 1992
16.707
+0.04
0.24%
1 janv. 1993
16.72
+0.013
0.08%
1 janv. 1994
16.702
-0.018
-0.11%
1 janv. 1995
16.655
-0.047
-0.28%
1 janv. 1996
16.754
+0.099
0.6%
1 janv. 1997
17.047
+0.293
1.75%
1 janv. 1998
17.638
+0.591
3.47%
1 janv. 1999
18.194
+0.556
3.15%
1 janv. 2000
18.62
+0.426
2.34%
1 janv. 2001
18.91
+0.29
1.56%
1 janv. 2002
19.134
+0.224
1.18%
1 janv. 2003
19.326
+0.192
1.0%
1 janv. 2004
19.5
+0.174
0.9%
1 janv. 2005
19.67
+0.17
0.87%
1 janv. 2006
19.815
+0.145
0.73%
1 janv. 2007
19.981
+0.166
0.84%
1 janv. 2008
20.305
+0.324
1.62%
1 janv. 2009
20.931
+0.626
3.08%
1 janv. 2010
21.671
+0.74
3.54%
1 janv. 2011
22.388
+0.717
3.31%
1 janv. 2012
22.955
+0.567
2.53%
1 janv. 2013
23.283
+0.328
1.43%
1 janv. 2014
23.776
+0.493
2.12%
1 janv. 2015
24.361
+0.585
2.46%
1 janv. 2016
25.031
+0.67
2.75%
Classement des pays selon les statistiques actuelles par années


Commentaires: