29
/es/
es
AIzaSyAYiBZKx7MnpbEhh9jyipgxe19OcubqV5w
April 1, 2024
68540
Angola
AGO
true
2
1
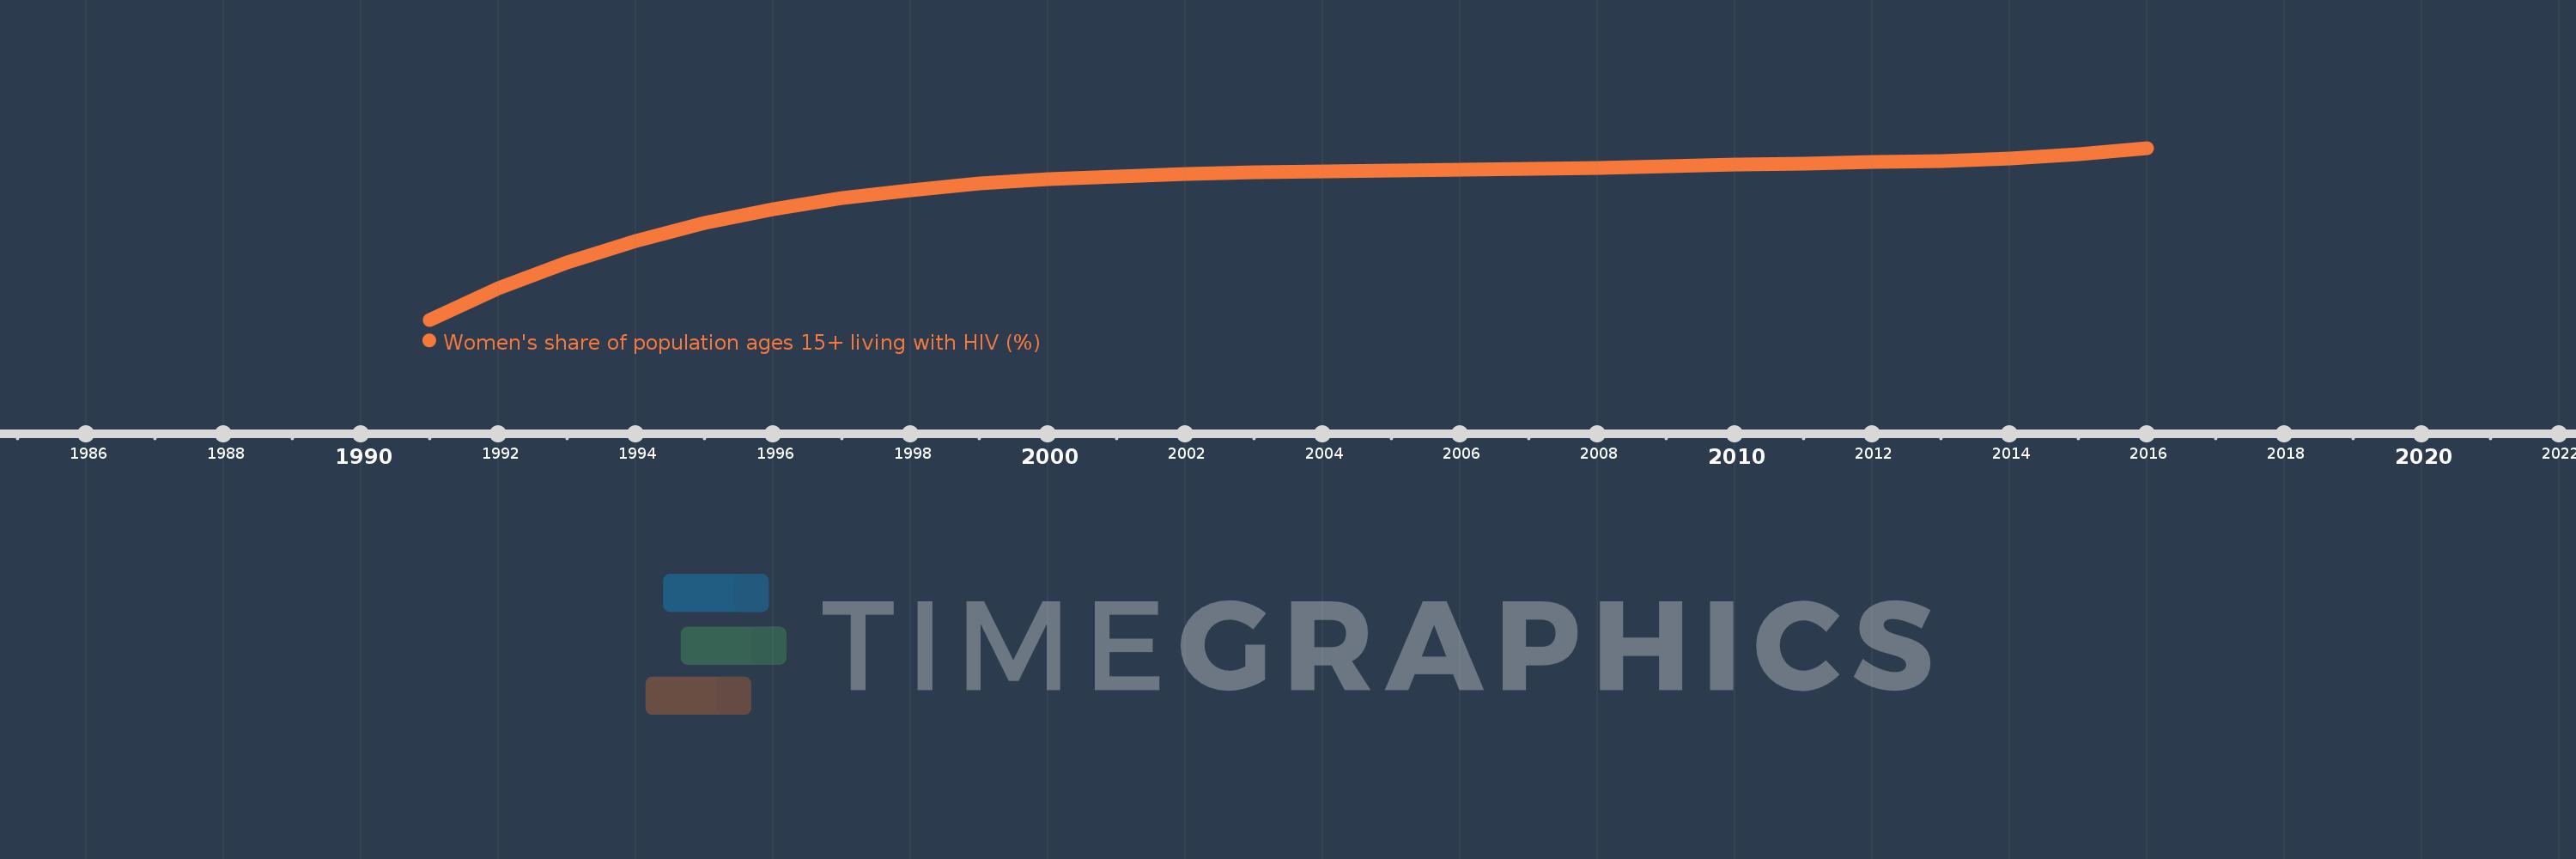
Women's share of population ages 15+ living with HIV (%)
2016,2015,2014,2013,2012,2011,2010,2009,2008,2007,2006,2005,2004,2003,2002,2001,2000,1999,1998,1997,1996,1995,1994,1993,1992,1991
Estas estadísticas en otros países:
línea de tiempo (timeline):
En esta escala de tiempo se presenta un gráfico de 1991 y 2016 de Angola. Los datos de 1990 están ausentes. El número de observaciones reales por fecha: 26.
Fuente (nombre):
Indicadores del desarrollo mundial
Fuente (organización):
UNAIDS estimates.
Categorías:
Health, Gender
Se ha actualizado:
23 abr 2017 año
Los indicadores de los cambios de valor en los últimos años
Mínimo:
54.167
1 ene 1991 año
Máximo:
59.709
1 ene 2016 año
A la fecha de observación
Valor
Cambio absoluto
El cambio con respecto al valor anterior
1 ene 1991 año
54.167
+54.167
0.0%
1 ene 1992 año
55.175
+1.008
1.86%
1 ene 1993 año
56.011
+0.836
1.52%
1 ene 1994 año
56.716
+0.704
1.26%
1 ene 1995 año
57.278
+0.562
0.99%
1 ene 1996 año
57.724
+0.446
0.78%
1 ene 1997 año
58.088
+0.364
0.63%
1 ene 1998 año
58.355
+0.267
0.46%
1 ene 1999 año
58.551
+0.196
0.34%
1 ene 2000 año
58.694
+0.142
0.24%
1 ene 2001 año
58.796
+0.103
0.18%
1 ene 2002 año
58.871
+0.074
0.13%
1 ene 2003 año
58.924
+0.053
0.09%
1 ene 2004 año
58.962
+0.038
0.06%
1 ene 2005 año
58.989
+0.027
0.05%
1 ene 2006 año
59.011
+0.022
0.04%
1 ene 2007 año
59.031
+0.02
0.03%
1 ene 2008 año
59.076
+0.045
0.08%
1 ene 2009 año
59.126
+0.05
0.08%
1 ene 2010 año
59.166
+0.04
0.07%
1 ene 2011 año
59.212
+0.047
0.08%
1 ene 2012 año
59.259
+0.047
0.08%
1 ene 2013 año
59.297
+0.038
0.06%
1 ene 2014 año
59.359
+0.061
0.1%
1 ene 2015 año
59.517
+0.159
0.27%
1 ene 2016 año
59.709
+0.192
0.32%
Ranking de los países por los datos estadísticos actuales


Comentarios: