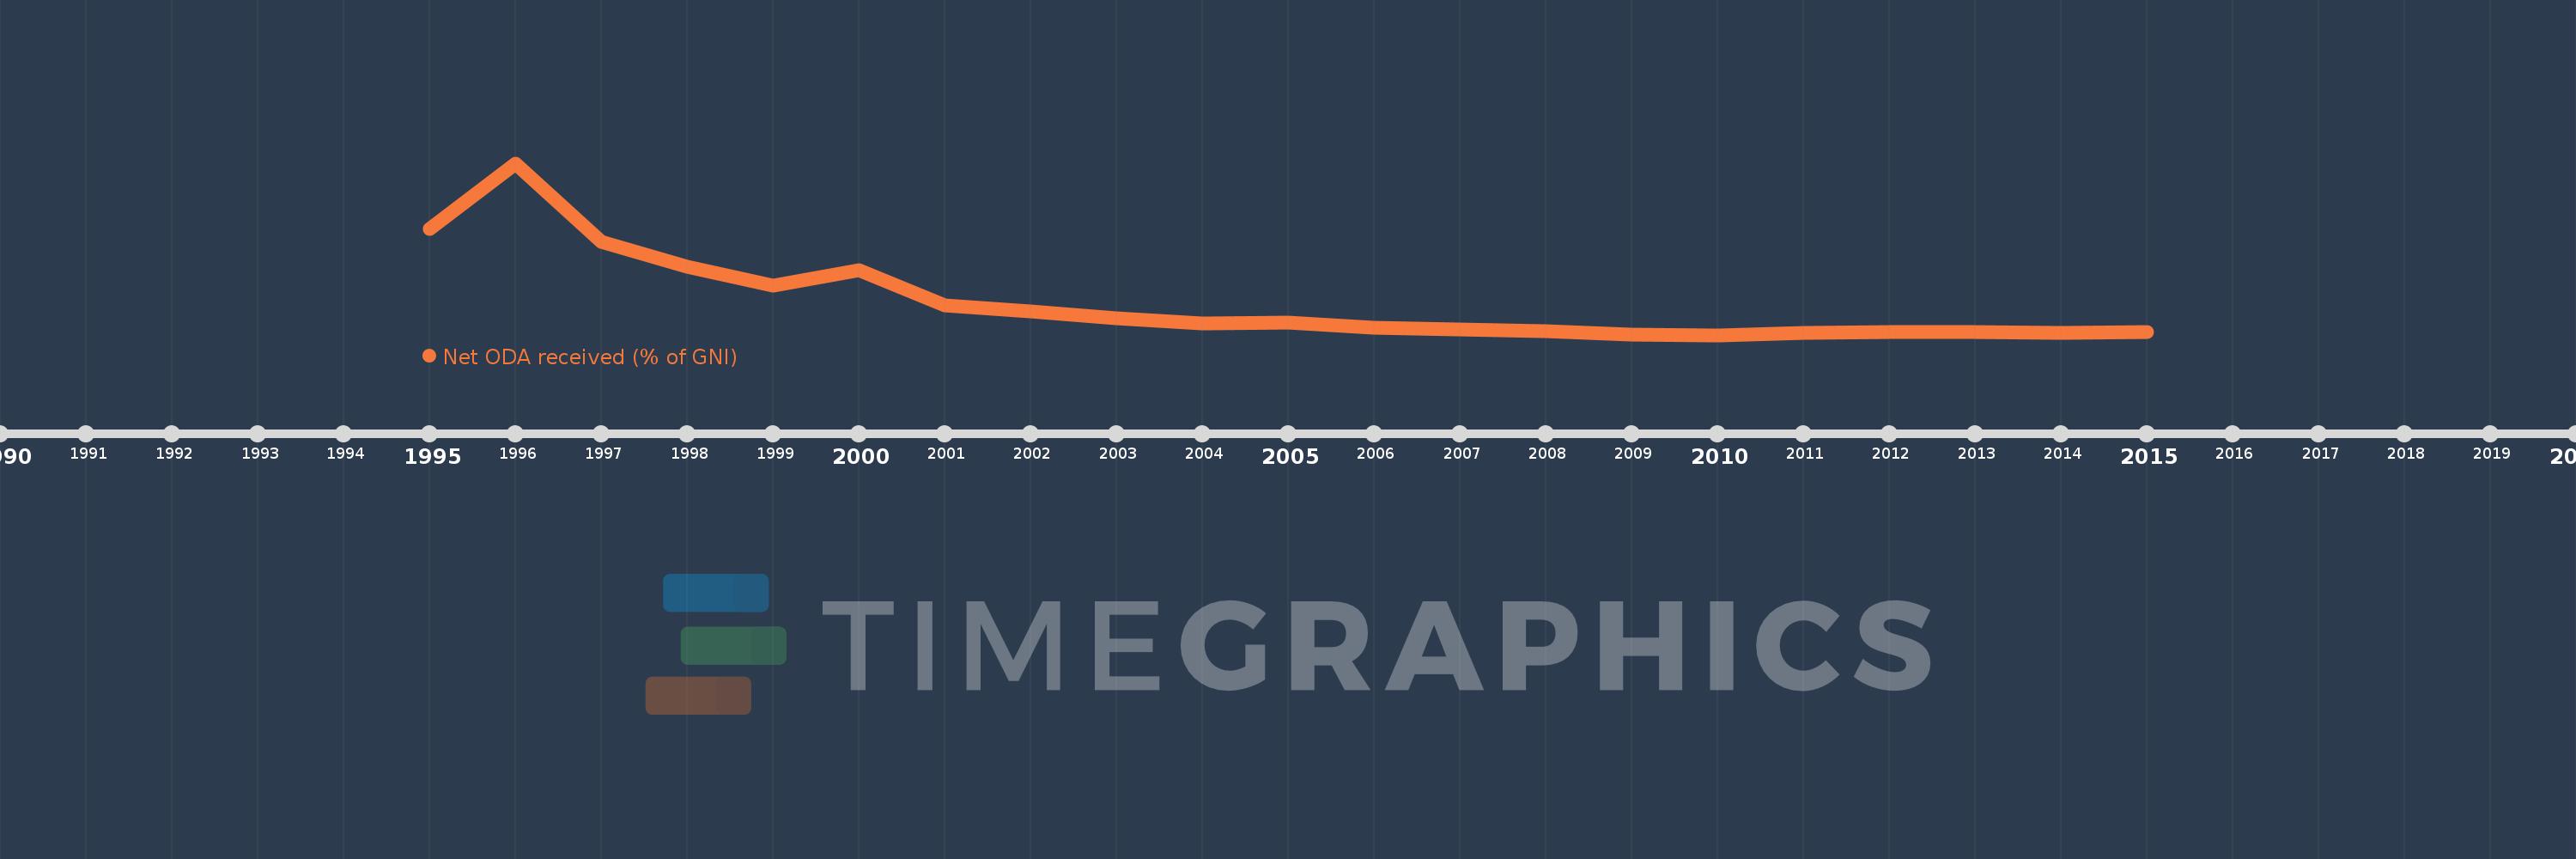
This timeline shows a graph from 1995 to 2015 of Bosnia and Herzegovina. No data until 1994. Number of actual observations by date: 21.
Source name:
World Development Indicators
Source organization:
Development Assistance Committee of the Organisation for Economic Co-operation and Development, Geographical Distribution of Financial Flows to Developing Countries, Development Co-operation Report, and International Development Statistics database. Data are available online at: www.oecd.org/dac/stats/idsonline. World Bank GNI estimates are used for the denominator.
Categories, topics:
Aid Effectiveness, Economy & Growth, External Debt
Last updated:
apr 23, 2017
Indicators value changes by year
Meaning:
12.998
Minimum:
2.267
jan 1, 2010
Maximum:
59.449
jan 1, 1996
At the date of observation
Value
Absolute change
Change from the previous value
jan 1, 1995
37.456
+37.456
0.0%
jan 1, 1996
59.449
+21.994
58.72%
jan 1, 1997
33.221
-26.228
-44.12%
jan 1, 1998
25.032
-8.19
-24.65%
jan 1, 1999
18.574
-6.457
-25.8%
jan 1, 2000
23.759
+5.185
27.91%
jan 1, 2001
12.105
-11.654
-49.05%
jan 1, 2002
10.18
-1.925
-15.9%
jan 1, 2003
7.762
-2.418
-23.75%
jan 1, 2004
6.087
-1.675
-21.58%
jan 1, 2005
6.517
+0.43
7.07%
jan 1, 2006
4.691
-1.826
-28.02%
jan 1, 2007
4.035
-0.656
-13.98%
jan 1, 2008
3.69
-0.345
-8.54%
jan 1, 2009
2.358
-1.333
-36.11%
jan 1, 2010
2.267
-0.091
-3.87%
jan 1, 2011
2.913
+0.647
28.53%
jan 1, 2012
3.336
+0.423
14.52%
jan 1, 2013
3.292
-0.045
-1.33%
jan 1, 2014
2.839
-0.453
-13.75%
jan 1, 2015
3.386
+0.547
19.27%
Ranking of countries by current statistics by years