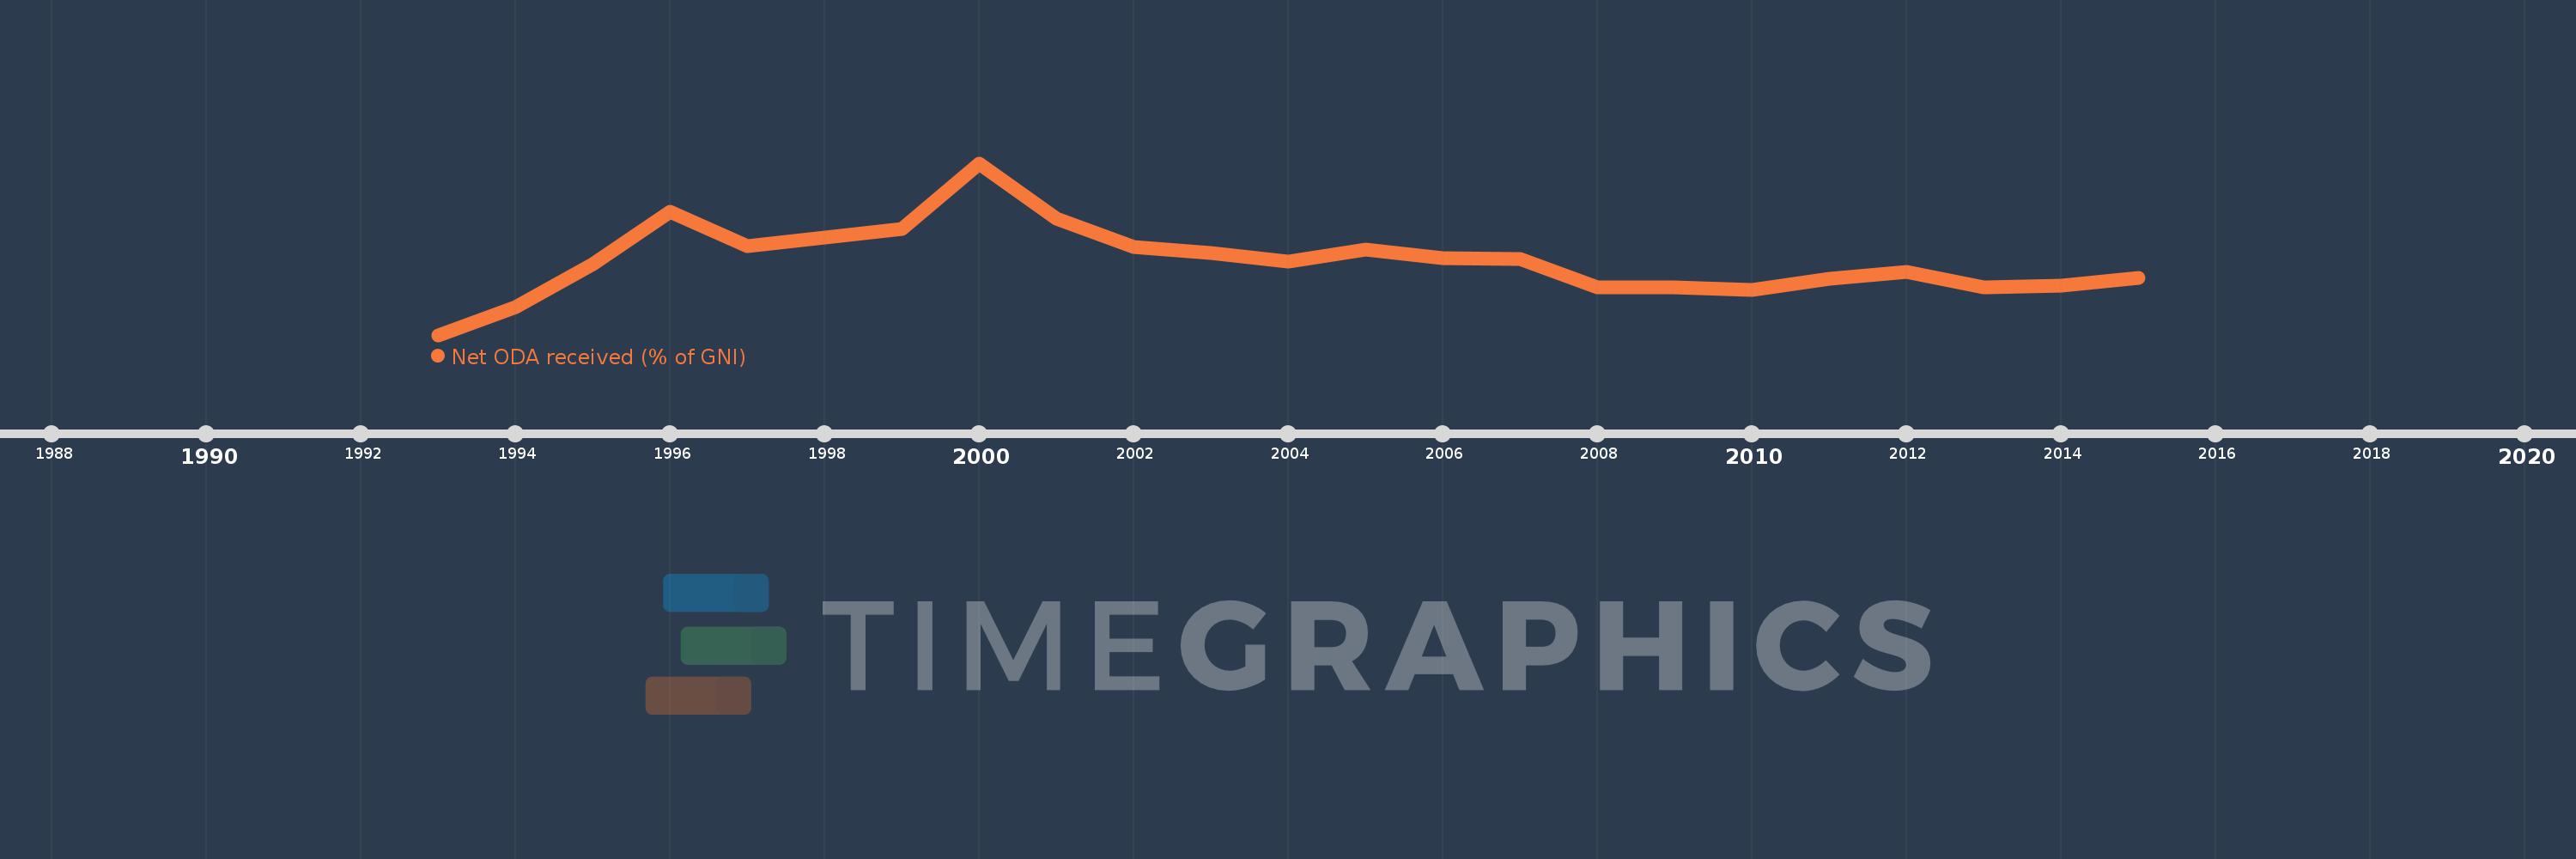
This timeline shows a graph from 1993 to 2015 of Kyrgyz Republic. No data until 1992. Number of actual observations by date: 23.
Source name:
World Development Indicators
Source organization:
Development Assistance Committee of the Organisation for Economic Co-operation and Development, Geographical Distribution of Financial Flows to Developing Countries, Development Co-operation Report, and International Development Statistics database. Data are available online at: www.oecd.org/dac/stats/idsonline. World Bank GNI estimates are used for the denominator.
Categories, topics:
Aid Effectiveness, Economy & Growth, External Debt
Last updated:
apr 23, 2017
Indicators value changes by year
Meaning:
10.874
Minimum:
0.91
jan 1, 1993
Maximum:
24.094
jan 1, 2000
At the date of observation
Value
Absolute change
Change from the previous value
jan 1, 1993
0.91
+0.91
0.0%
jan 1, 1994
4.697
+3.787
416.21%
jan 1, 1995
10.458
+5.761
122.64%
jan 1, 1996
17.512
+7.054
67.45%
jan 1, 1997
12.888
-4.624
-26.41%
jan 1, 1998
14.065
+1.177
9.13%
jan 1, 1999
15.283
+1.218
8.66%
jan 1, 2000
24.094
+8.812
57.66%
jan 1, 2001
16.674
-7.421
-30.8%
jan 1, 2002
12.82
-3.854
-23.11%
jan 1, 2003
11.992
-0.828
-6.46%
jan 1, 2004
10.775
-1.216
-10.14%
jan 1, 2005
12.388
+1.612
14.96%
jan 1, 2006
11.293
-1.095
-8.84%
jan 1, 2007
11.147
-0.146
-1.29%
jan 1, 2008
7.317
-3.83
-34.35%
jan 1, 2009
7.296
-0.021
-0.29%
jan 1, 2010
6.951
-0.346
-4.74%
jan 1, 2011
8.503
+1.552
22.33%
jan 1, 2012
9.474
+0.971
11.42%
jan 1, 2013
7.328
-2.146
-22.65%
jan 1, 2014
7.614
+0.286
3.9%
jan 1, 2015
8.619
+1.005
13.2%
Ranking of countries by current statistics by years