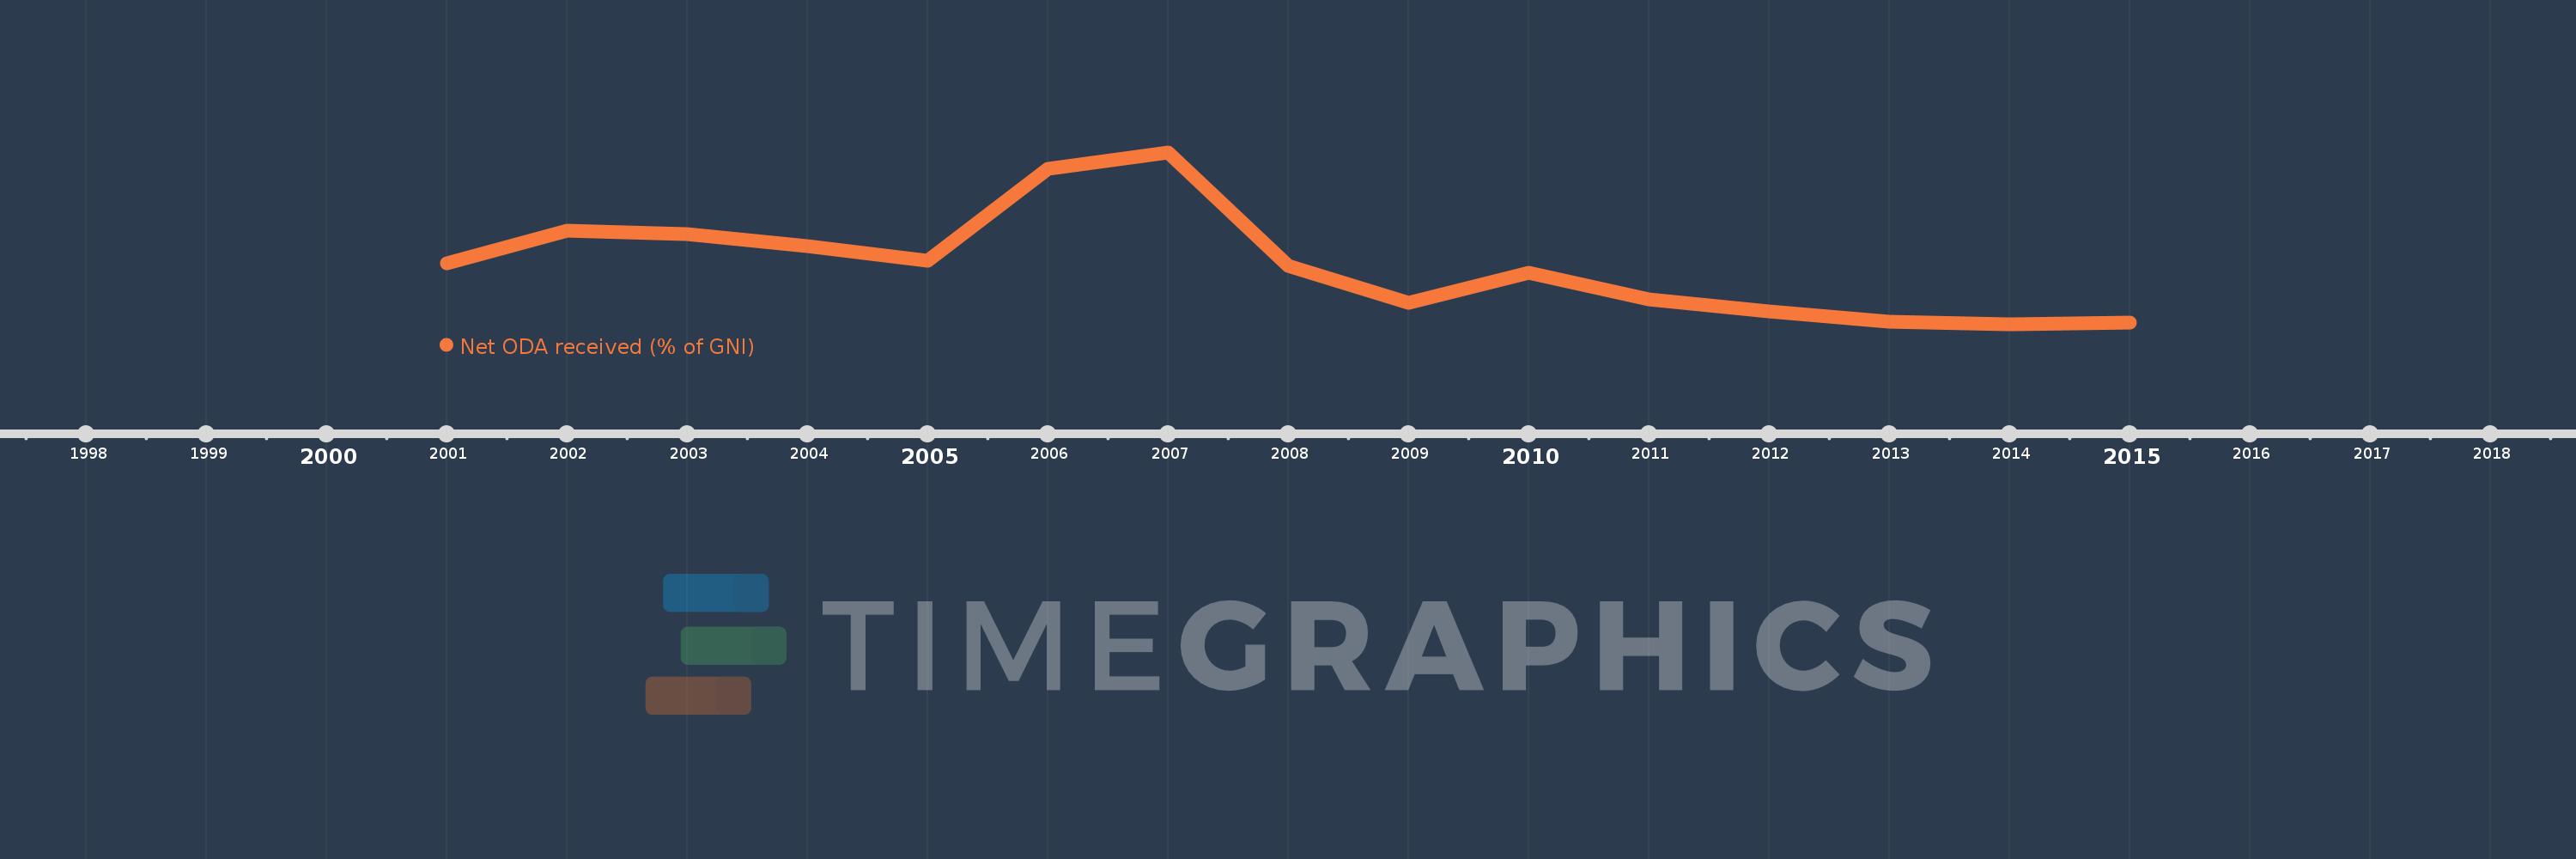
This timeline shows a graph from 2001 to 2015 of IDA blend. No data until 2000. Number of actual observations by date: 15.
Source name:
World Development Indicators
Source organization:
Development Assistance Committee of the Organisation for Economic Co-operation and Development, Geographical Distribution of Financial Flows to Developing Countries, Development Co-operation Report, and International Development Statistics database. Data are available online at: www.oecd.org/dac/stats/idsonline. World Bank GNI estimates are used for the denominator.
Categories, topics:
Aid Effectiveness, Economy & Growth, External Debt
Last updated:
apr 23, 2017
Indicators value changes by year
Meaning:
2.378
Minimum:
1.203
jan 1, 2014
Maximum:
4.617
jan 1, 2007
At the date of observation
Value
Absolute change
Change from the previous value
jan 1, 2001
2.413
+2.413
0.0%
jan 1, 2002
3.068
+0.655
27.13%
jan 1, 2003
2.992
-0.076
-2.48%
jan 1, 2004
2.757
-0.235
-7.86%
jan 1, 2005
2.461
-0.296
-10.73%
jan 1, 2006
4.288
+1.827
74.23%
jan 1, 2007
4.617
+0.329
7.68%
jan 1, 2008
2.361
-2.255
-48.85%
jan 1, 2009
1.636
-0.726
-30.74%
jan 1, 2010
2.228
+0.593
36.23%
jan 1, 2011
1.7
-0.528
-23.69%
jan 1, 2012
1.459
-0.241
-14.18%
jan 1, 2013
1.258
-0.202
-13.81%
jan 1, 2014
1.203
-0.055
-4.34%
jan 1, 2015
1.227
+0.024
1.97%
Ranking of countries by current statistics by years