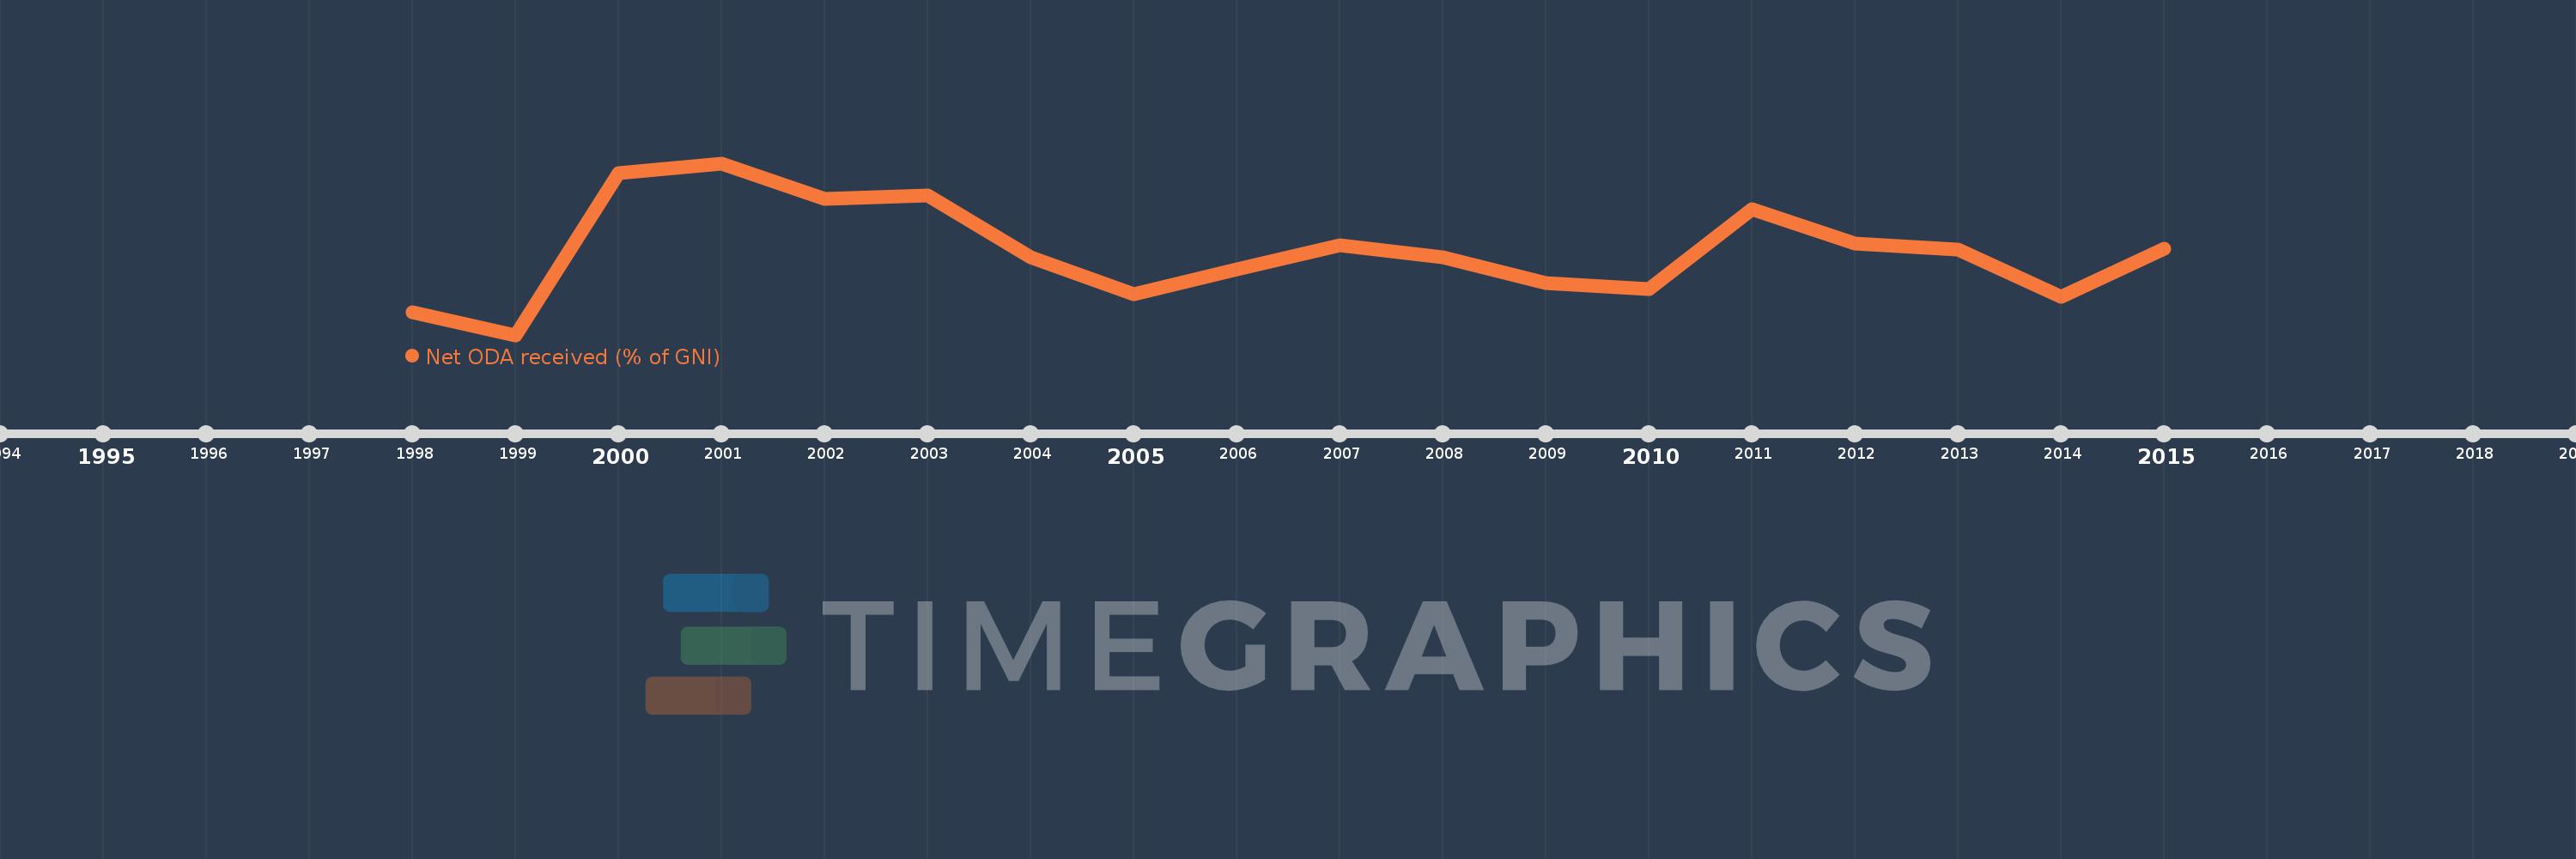
This timeline shows a graph from 1998 to 2015 of Moldova. No data until 1997. Number of actual observations by date: 18.
Source name:
World Development Indicators
Source organization:
Development Assistance Committee of the Organisation for Economic Co-operation and Development, Geographical Distribution of Financial Flows to Developing Countries, Development Co-operation Report, and International Development Statistics database. Data are available online at: www.oecd.org/dac/stats/idsonline. World Bank GNI estimates are used for the denominator.
Categories, topics:
Aid Effectiveness, Economy & Growth, External Debt
Last updated:
apr 23, 2017
Indicators value changes by year
Meaning:
5.781
Minimum:
2.367
jan 1, 1999
Maximum:
9.351
jan 1, 2001
At the date of observation
Value
Absolute change
Change from the previous value
jan 1, 1998
3.302
+3.302
0.0%
jan 1, 1999
2.367
-0.934
-28.3%
jan 1, 2000
8.96
+6.593
278.49%
jan 1, 2001
9.351
+0.391
4.36%
jan 1, 2002
7.914
-1.437
-15.37%
jan 1, 2003
8.05
+0.136
1.72%
jan 1, 2004
5.521
-2.529
-31.41%
jan 1, 2005
4.038
-1.483
-26.86%
jan 1, 2006
5.052
+1.014
25.12%
jan 1, 2007
6.03
+0.978
19.35%
jan 1, 2008
5.535
-0.496
-8.22%
jan 1, 2009
4.484
-1.05
-18.98%
jan 1, 2010
4.24
-0.244
-5.44%
jan 1, 2011
7.493
+3.253
76.72%
jan 1, 2012
6.074
-1.419
-18.94%
jan 1, 2013
5.844
-0.23
-3.78%
jan 1, 2014
3.918
-1.926
-32.96%
jan 1, 2015
5.874
+1.956
49.93%
Ranking of countries by current statistics by years