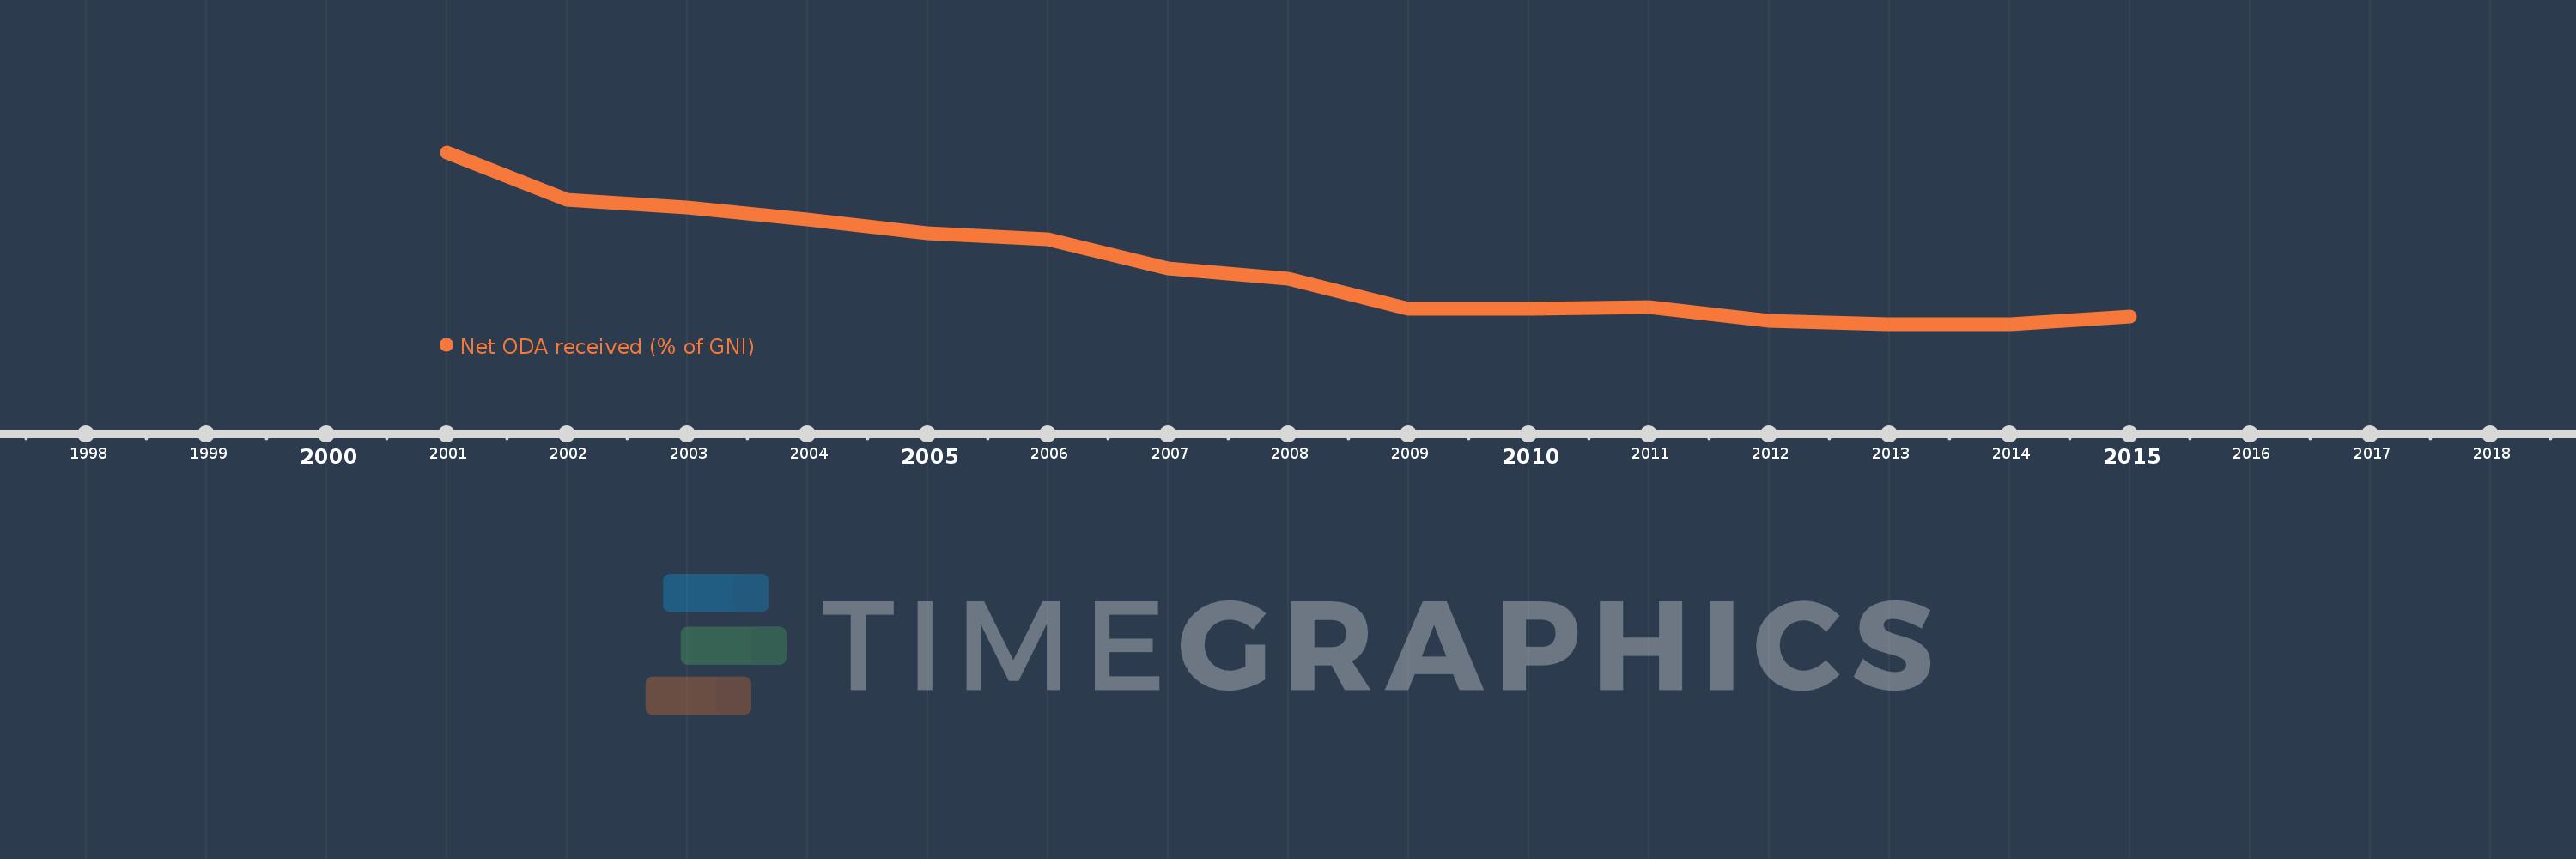
This timeline shows a graph from 2001 to 2015 of Timor-Leste. No data until 2000. Number of actual observations by date: 15.
Source name:
World Development Indicators
Source organization:
Development Assistance Committee of the Organisation for Economic Co-operation and Development, Geographical Distribution of Financial Flows to Developing Countries, Development Co-operation Report, and International Development Statistics database. Data are available online at: www.oecd.org/dac/stats/idsonline. World Bank GNI estimates are used for the denominator.
Categories, topics:
Aid Effectiveness, Economy & Growth, External Debt
Last updated:
apr 23, 2017
Indicators value changes by year
Meaning:
16.655
Minimum:
5.475
jan 1, 2013
Maximum:
39.198
jan 1, 2001
At the date of observation
Value
Absolute change
Change from the previous value
jan 1, 2001
39.198
+39.198
0.0%
jan 1, 2002
29.918
-9.28
-23.67%
jan 1, 2003
28.338
-1.581
-5.28%
jan 1, 2004
25.969
-2.369
-8.36%
jan 1, 2005
23.402
-2.567
-9.88%
jan 1, 2006
22.18
-1.222
-5.22%
jan 1, 2007
16.462
-5.718
-25.78%
jan 1, 2008
14.478
-1.984
-12.05%
jan 1, 2009
8.521
-5.957
-41.14%
jan 1, 2010
8.468
-0.053
-0.63%
jan 1, 2011
8.841
+0.373
4.4%
jan 1, 2012
6.053
-2.787
-31.53%
jan 1, 2013
5.475
-0.578
-9.55%
jan 1, 2014
5.531
+0.056
1.03%
jan 1, 2015
6.992
+1.461
26.42%
Ranking of countries by current statistics by years