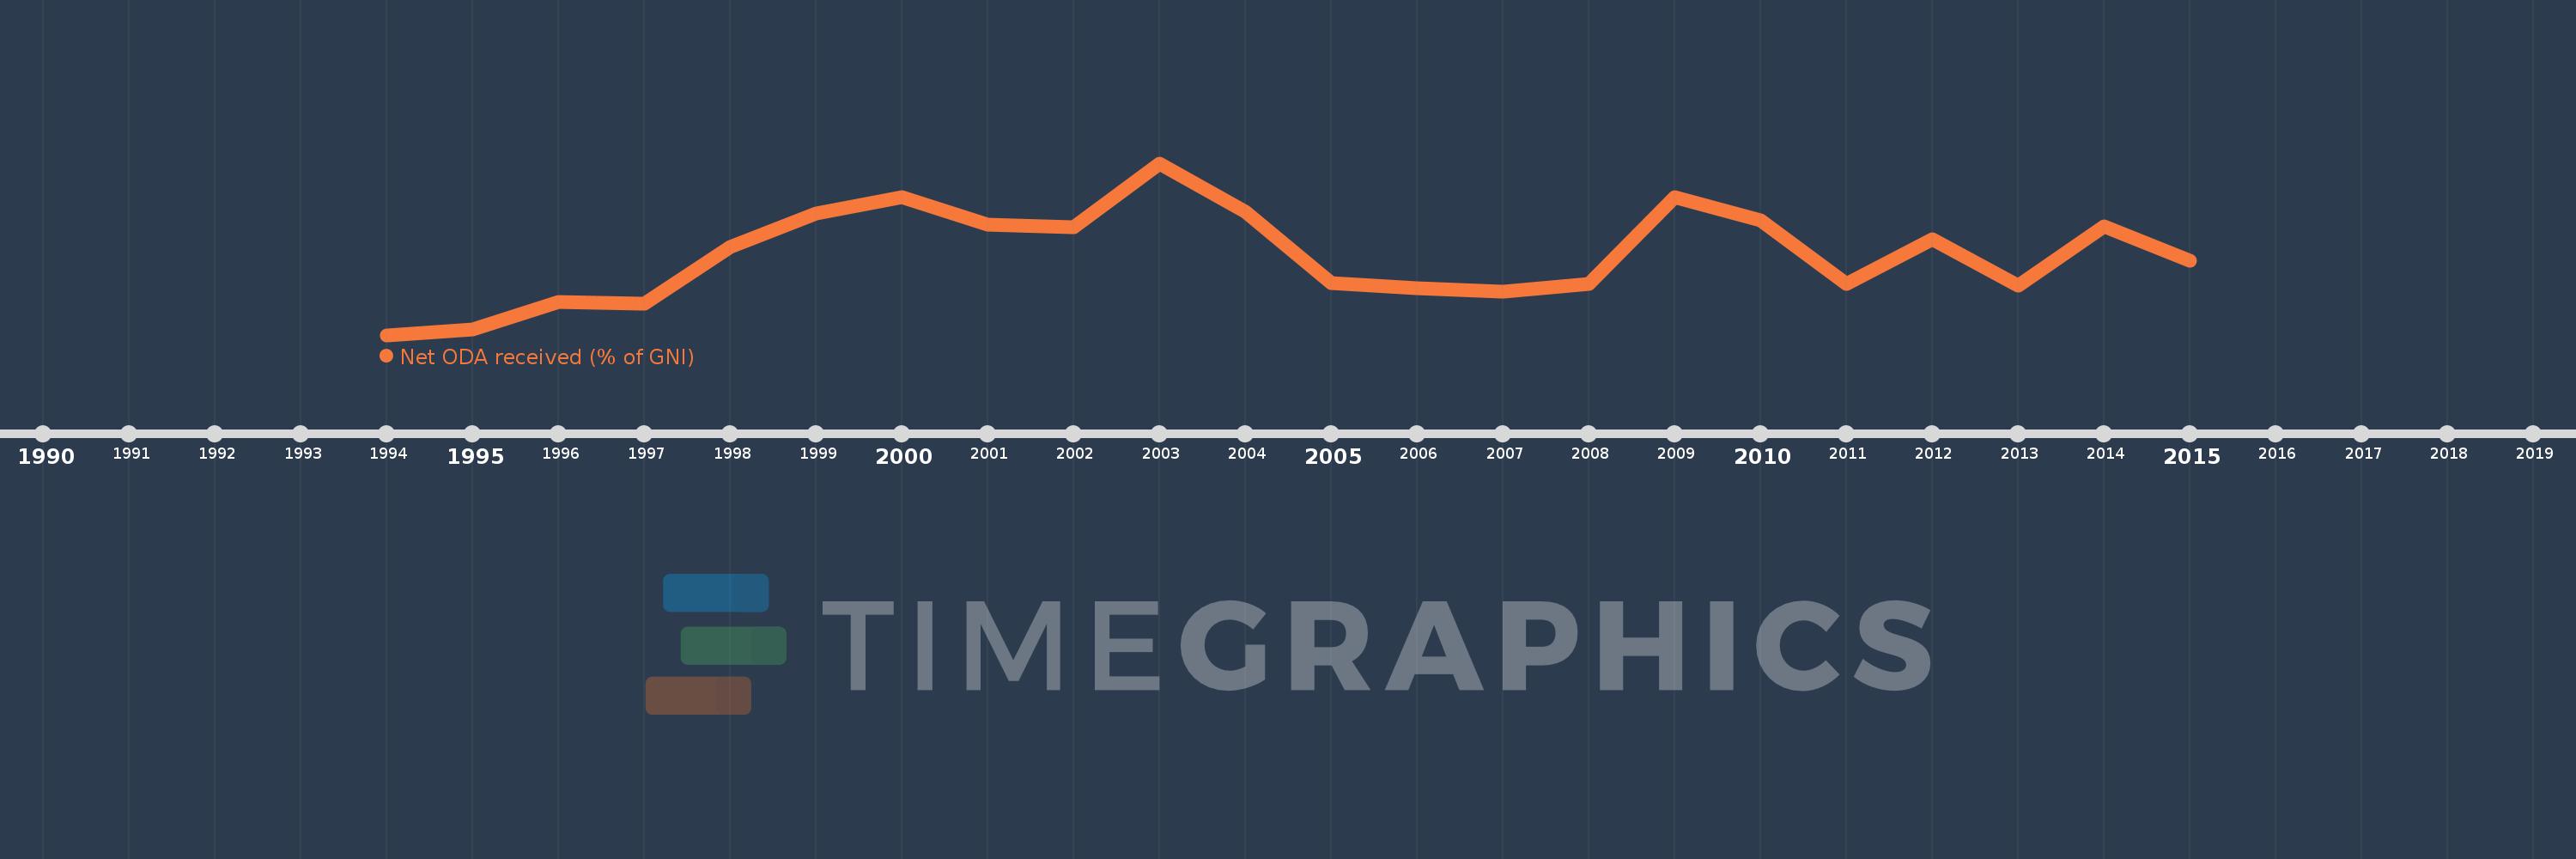
This timeline shows a graph from 1994 to 2015 of South Africa. No data until 1993. Number of actual observations by date: 22.
Source name:
World Development Indicators
Source organization:
Development Assistance Committee of the Organisation for Economic Co-operation and Development, Geographical Distribution of Financial Flows to Developing Countries, Development Co-operation Report, and International Development Statistics database. Data are available online at: www.oecd.org/dac/stats/idsonline. World Bank GNI estimates are used for the denominator.
Categories, topics:
Aid Effectiveness, Economy & Growth, External Debt
Last updated:
apr 23, 2017
Indicators value changes by year
Meaning:
0.321
Minimum:
0.205
jan 1, 1994
Maximum:
0.454
jan 1, 2003
At the date of observation
Value
Absolute change
Change from the previous value
jan 1, 1994
0.205
+0.205
0.0%
jan 1, 1995
0.213
+0.008
3.88%
jan 1, 1996
0.253
+0.04
18.59%
jan 1, 1997
0.251
-0.002
-0.92%
jan 1, 1998
0.332
+0.081
32.32%
jan 1, 1999
0.381
+0.049
14.85%
jan 1, 2000
0.405
+0.024
6.29%
jan 1, 2001
0.365
-0.04
-9.85%
jan 1, 2002
0.361
-0.004
-1.1%
jan 1, 2003
0.454
+0.093
25.62%
jan 1, 2004
0.384
-0.069
-15.3%
jan 1, 2005
0.28
-0.104
-27.0%
jan 1, 2006
0.273
-0.008
-2.67%
jan 1, 2007
0.268
-0.005
-1.72%
jan 1, 2008
0.279
+0.01
3.91%
jan 1, 2009
0.405
+0.126
45.27%
jan 1, 2010
0.371
-0.034
-8.29%
jan 1, 2011
0.279
-0.092
-24.75%
jan 1, 2012
0.344
+0.064
23.04%
jan 1, 2013
0.276
-0.067
-19.61%
jan 1, 2014
0.362
+0.085
30.9%
jan 1, 2015
0.313
-0.049
-13.49%
Ranking of countries by current statistics by years