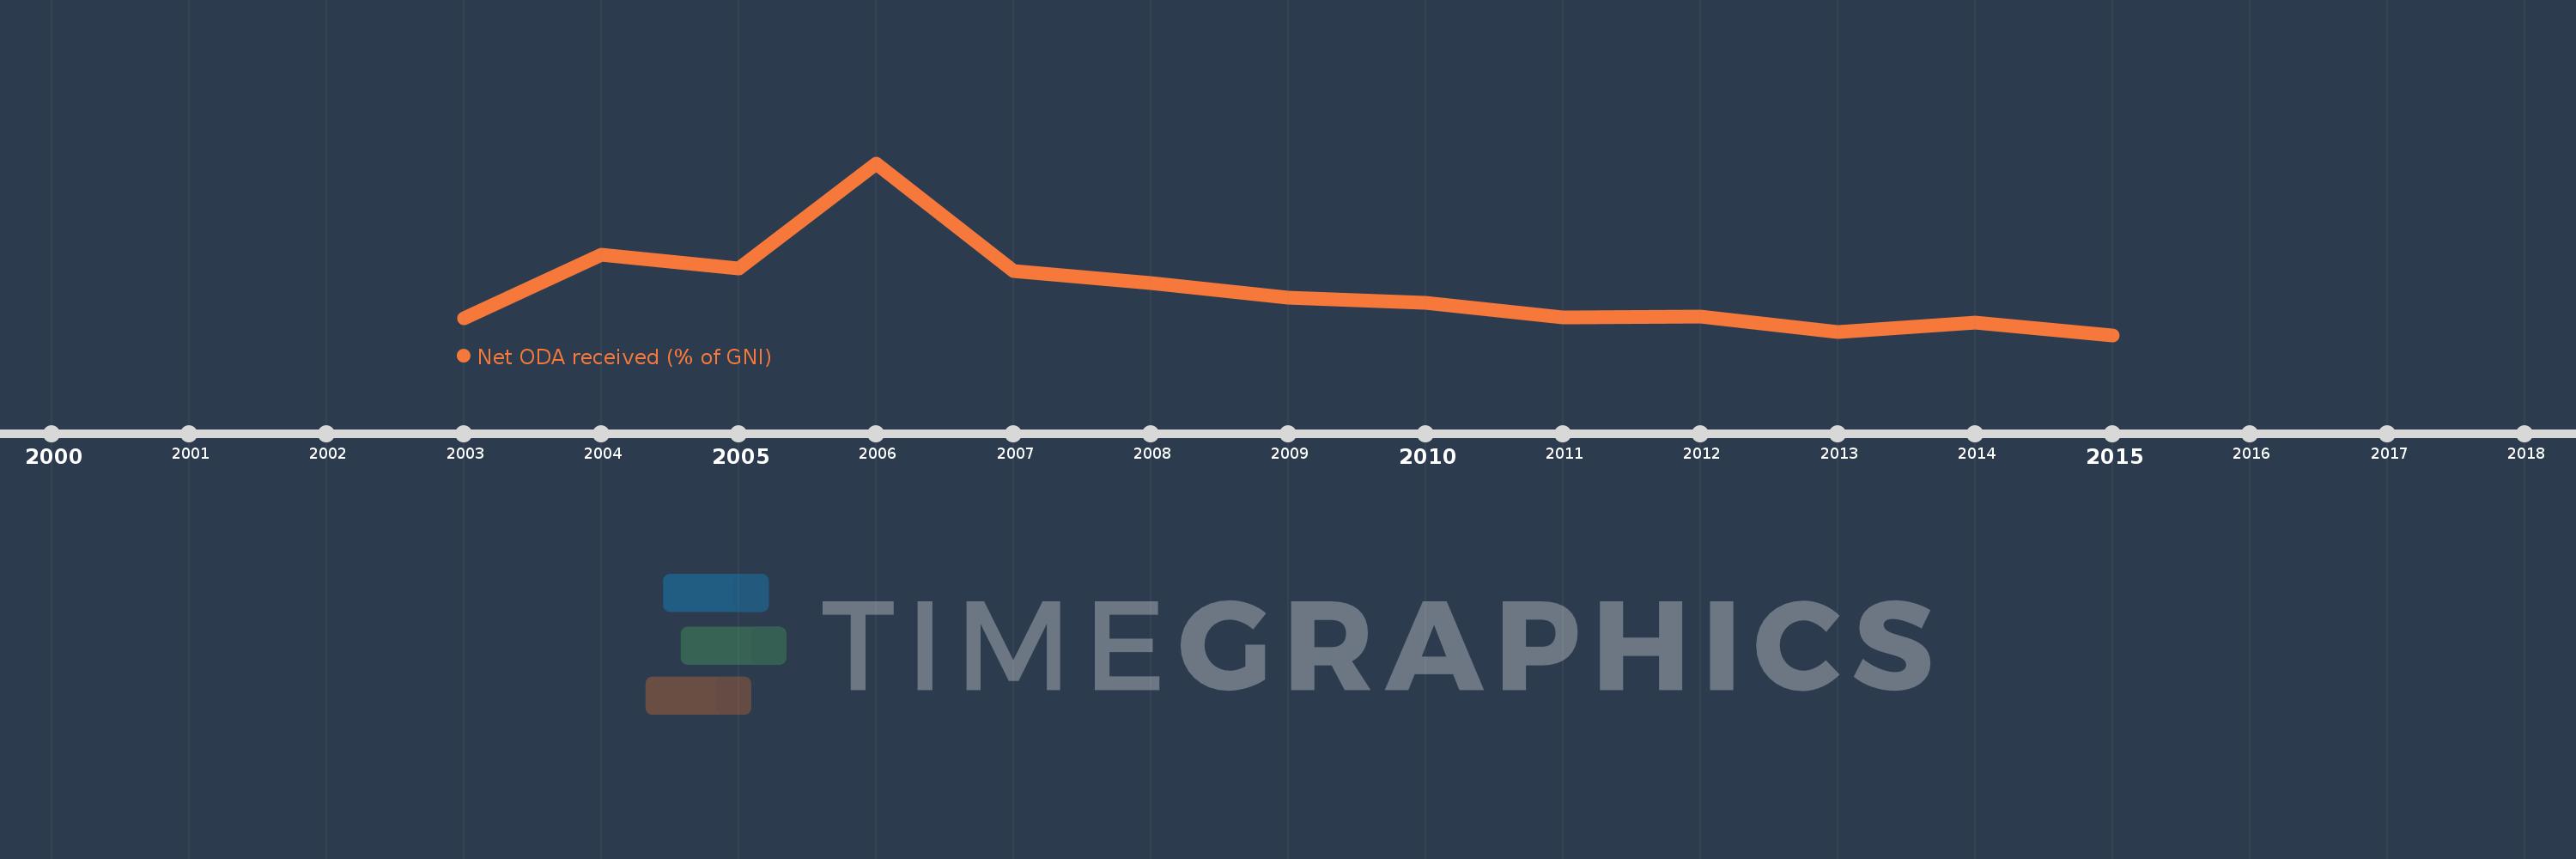
This timeline shows a graph from 2003 to 2015 of Fragile and conflict affected situations. No data until 2002. Number of actual observations by date: 13.
Source name:
World Development Indicators
Source organization:
Development Assistance Committee of the Organisation for Economic Co-operation and Development, Geographical Distribution of Financial Flows to Developing Countries, Development Co-operation Report, and International Development Statistics database. Data are available online at: www.oecd.org/dac/stats/idsonline. World Bank GNI estimates are used for the denominator.
Categories, topics:
Aid Effectiveness, Economy & Growth, External Debt
Last updated:
apr 23, 2017
Indicators value changes by year
Meaning:
6.339
Minimum:
4.212
jan 1, 2015
Maximum:
12.508
jan 1, 2006
At the date of observation
Value
Absolute change
Change from the previous value
jan 1, 2003
5.031
+5.031
0.0%
jan 1, 2004
8.079
+3.047
60.56%
jan 1, 2005
7.435
-0.644
-7.97%
jan 1, 2006
12.508
+5.073
68.23%
jan 1, 2007
7.284
-5.224
-41.77%
jan 1, 2008
6.724
-0.56
-7.69%
jan 1, 2009
6.001
-0.723
-10.75%
jan 1, 2010
5.784
-0.218
-3.63%
jan 1, 2011
5.081
-0.703
-12.15%
jan 1, 2012
5.095
+0.014
0.27%
jan 1, 2013
4.375
-0.72
-14.13%
jan 1, 2014
4.794
+0.419
9.58%
jan 1, 2015
4.212
-0.582
-12.13%
Ranking of countries by current statistics by years