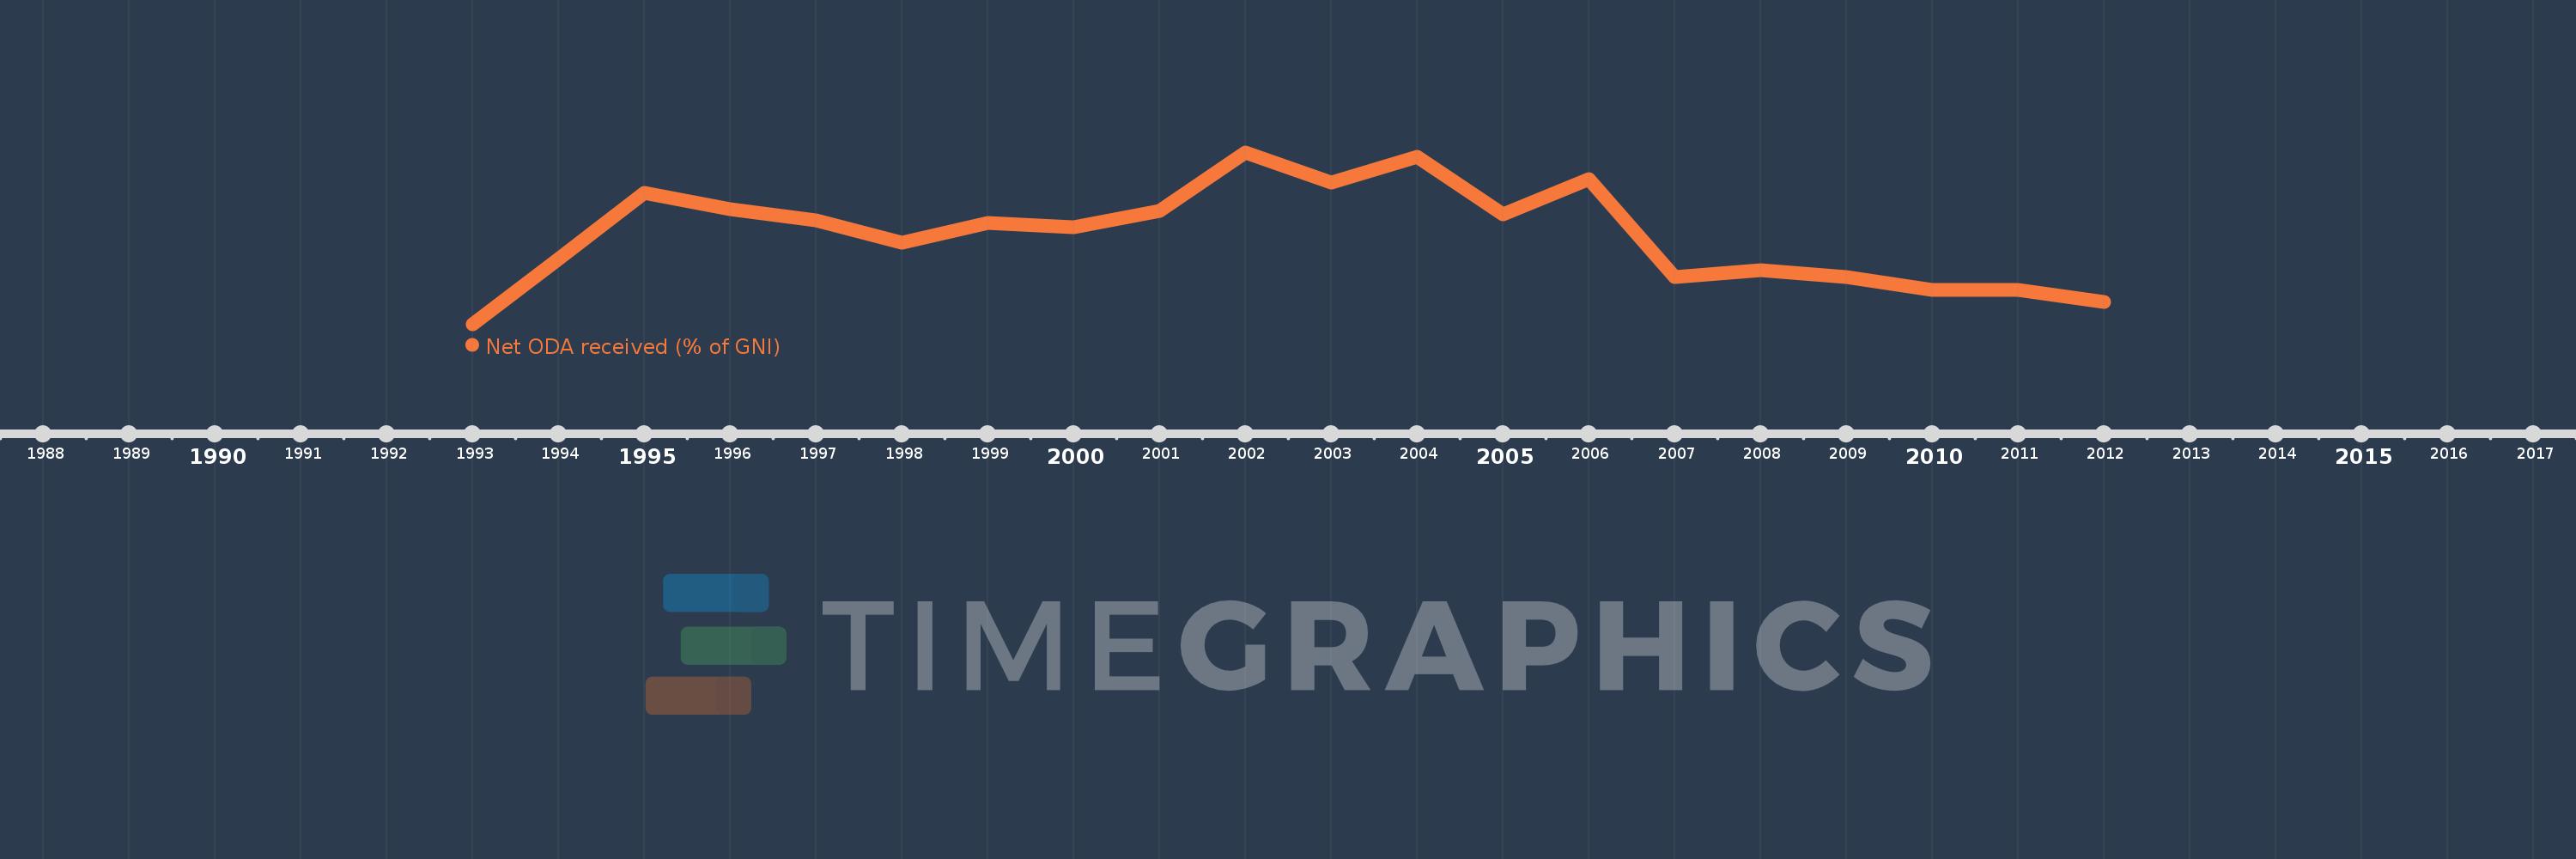
This timeline shows a graph from 1993 to 2012 of Eritrea. No data until 1992. Number of actual observations by date: 20.
Source name:
World Development Indicators
Source organization:
Development Assistance Committee of the Organisation for Economic Co-operation and Development, Geographical Distribution of Financial Flows to Developing Countries, Development Co-operation Report, and International Development Statistics database. Data are available online at: www.oecd.org/dac/stats/idsonline. World Bank GNI estimates are used for the denominator.
Categories, topics:
Aid Effectiveness, Economy & Growth, External Debt
Last updated:
apr 23, 2017
Indicators value changes by year
Meaning:
19.727
Minimum:
0.21
jan 1, 1993
Maximum:
37.826
jan 1, 2002
At the date of observation
Value
Absolute change
Change from the previous value
jan 1, 1993
0.21
+0.21
0.0%
jan 1, 1994
14.472
+14.262
6.8K%
jan 1, 1995
28.982
+14.51
100.26%
jan 1, 1996
25.324
-3.657
-12.62%
jan 1, 1997
22.963
-2.361
-9.32%
jan 1, 1998
18.047
-4.916
-21.41%
jan 1, 1999
22.313
+4.266
23.64%
jan 1, 2000
21.392
-0.921
-4.13%
jan 1, 2001
25.044
+3.651
17.07%
jan 1, 2002
37.826
+12.782
51.04%
jan 1, 2003
31.22
-6.606
-17.46%
jan 1, 2004
36.832
+5.612
17.98%
jan 1, 2005
24.219
-12.613
-34.24%
jan 1, 2006
32.068
+7.849
32.41%
jan 1, 2007
10.462
-21.606
-67.38%
jan 1, 2008
12.082
+1.621
15.49%
jan 1, 2009
10.485
-1.597
-13.22%
jan 1, 2010
7.807
-2.678
-25.54%
jan 1, 2011
7.657
-0.15
-1.93%
jan 1, 2012
5.145
-2.511
-32.8%
Ranking of countries by current statistics by years