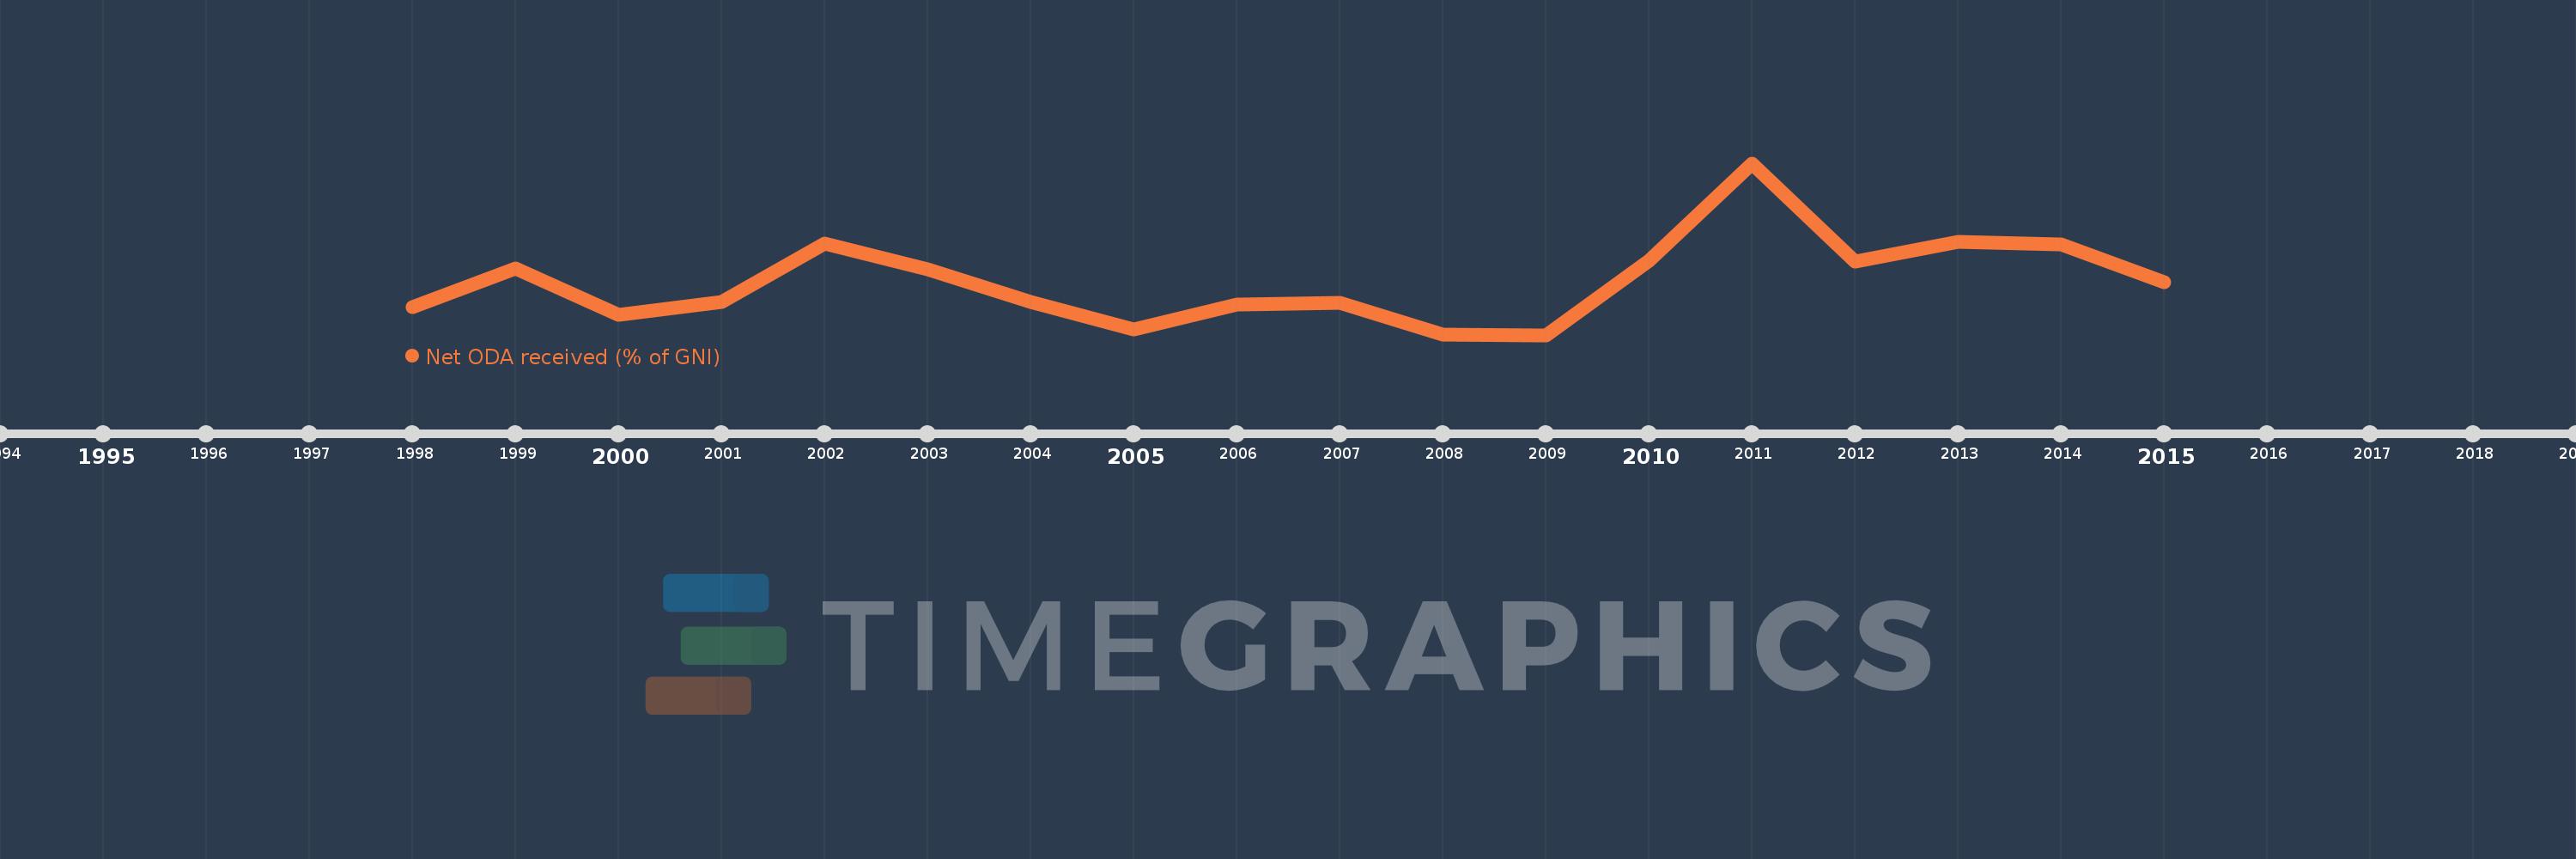
This timeline shows a graph from 1998 to 2015 of Samoa. No data until 1997. Number of actual observations by date: 18.
Source name:
World Development Indicators
Source organization:
Development Assistance Committee of the Organisation for Economic Co-operation and Development, Geographical Distribution of Financial Flows to Developing Countries, Development Co-operation Report, and International Development Statistics database. Data are available online at: www.oecd.org/dac/stats/idsonline. World Bank GNI estimates are used for the denominator.
Categories, topics:
Aid Effectiveness, Economy & Growth, External Debt
Last updated:
apr 23, 2017
Indicators value changes by year
Meaning:
12.008
Minimum:
6.98
jan 1, 2009
Maximum:
23.122
jan 1, 2011
At the date of observation
Value
Absolute change
Change from the previous value
jan 1, 1998
9.606
+9.606
0.0%
jan 1, 1999
13.267
+3.661
38.11%
jan 1, 2000
8.875
-4.392
-33.11%
jan 1, 2001
10.088
+1.213
13.67%
jan 1, 2002
15.605
+5.517
54.69%
jan 1, 2003
13.114
-2.49
-15.96%
jan 1, 2004
10.087
-3.027
-23.08%
jan 1, 2005
7.478
-2.609
-25.87%
jan 1, 2006
9.866
+2.388
31.93%
jan 1, 2007
9.981
+0.115
1.16%
jan 1, 2008
7.019
-2.962
-29.67%
jan 1, 2009
6.98
-0.039
-0.56%
jan 1, 2010
13.951
+6.971
99.87%
jan 1, 2011
23.122
+9.171
65.74%
jan 1, 2012
13.905
-9.217
-39.86%
jan 1, 2013
15.726
+1.821
13.1%
jan 1, 2014
15.49
-0.237
-1.5%
jan 1, 2015
11.977
-3.513
-22.68%
Ranking of countries by current statistics by years