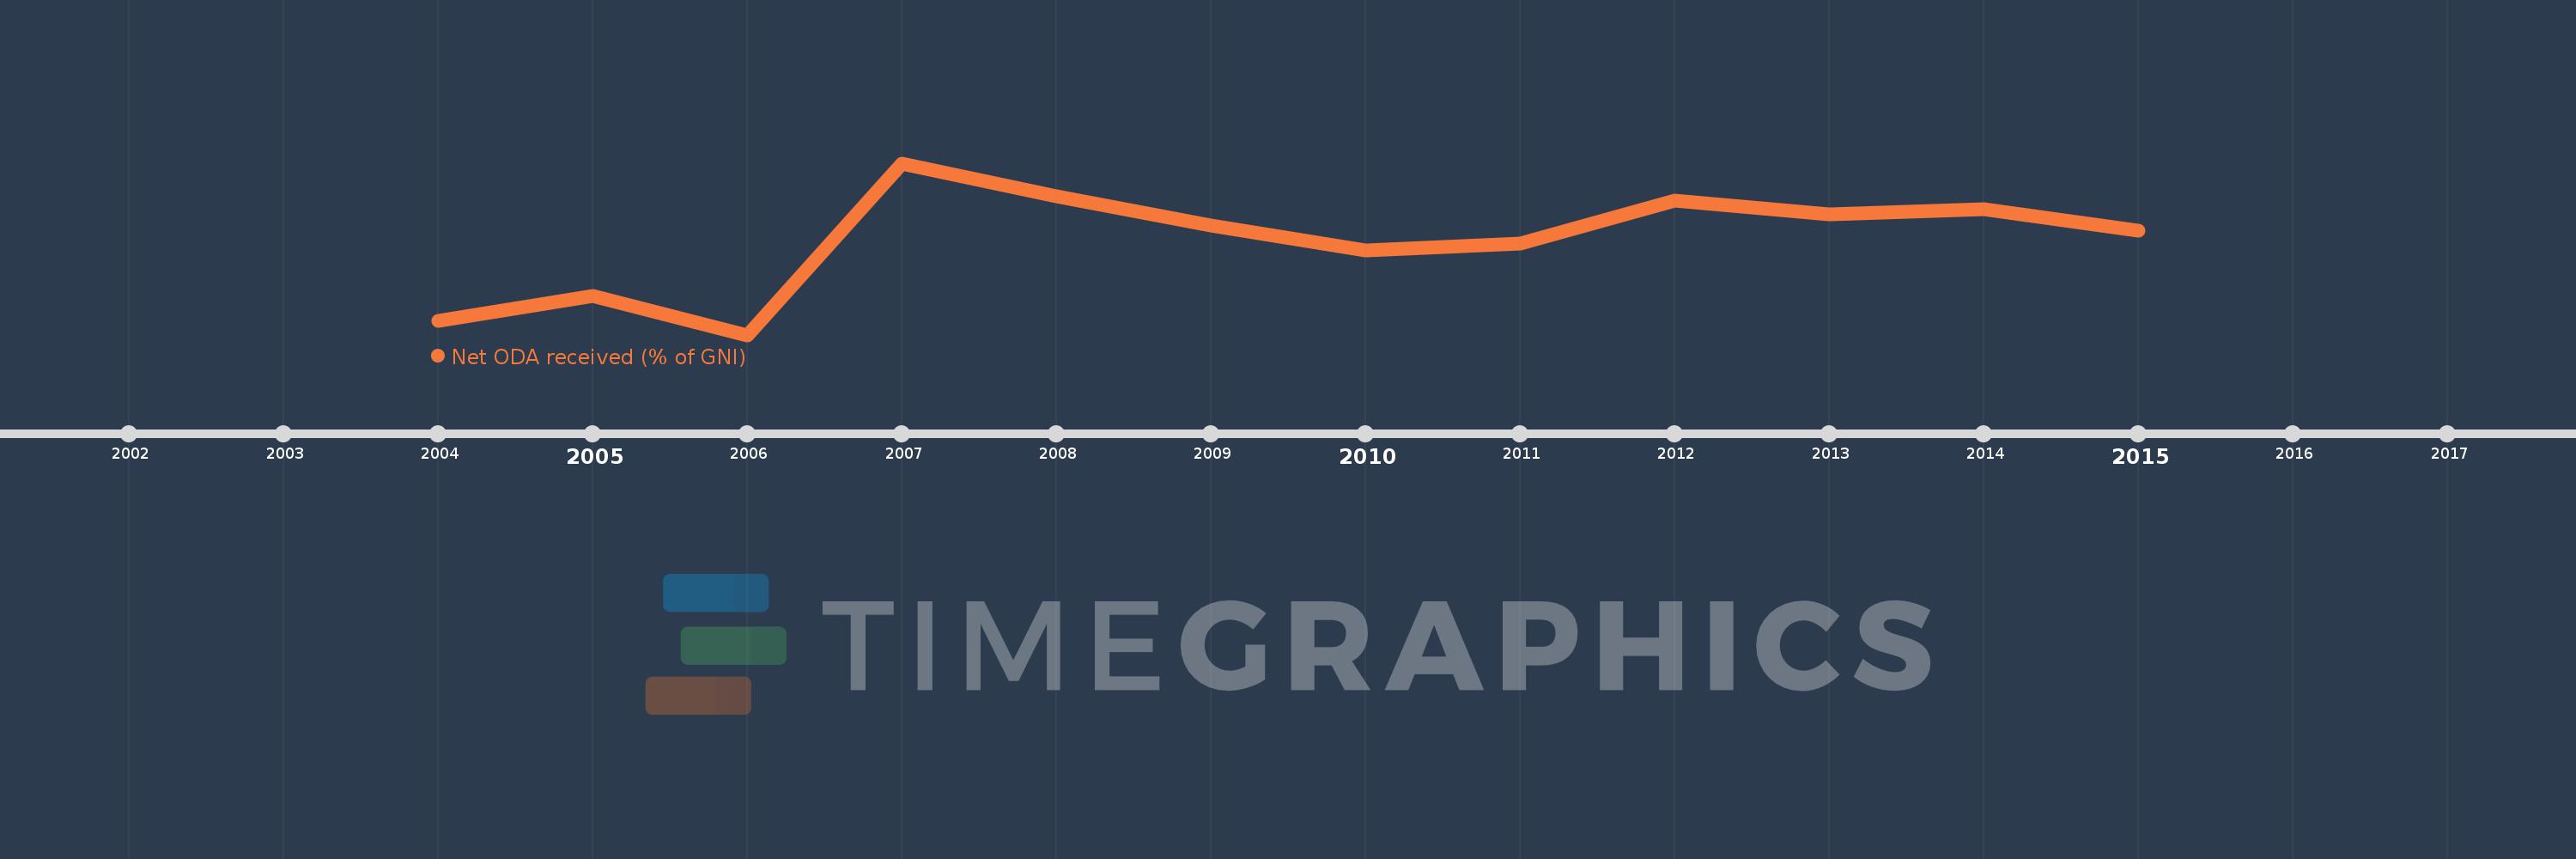
This timeline shows a graph from 2004 to 2015 of Montenegro. No data until 2003. Number of actual observations by date: 12.
Source name:
World Development Indicators
Source organization:
Development Assistance Committee of the Organisation for Economic Co-operation and Development, Geographical Distribution of Financial Flows to Developing Countries, Development Co-operation Report, and International Development Statistics database. Data are available online at: www.oecd.org/dac/stats/idsonline. World Bank GNI estimates are used for the denominator.
Categories, topics:
Aid Effectiveness, Economy & Growth, External Debt
Last updated:
apr 23, 2017
Indicators value changes by year
Meaning:
1.996
Minimum:
0.169
jan 1, 2006
Maximum:
3.487
jan 1, 2007
At the date of observation
Value
Absolute change
Change from the previous value
jan 1, 2004
0.45
+0.45
0.0%
jan 1, 2005
0.923
+0.473
104.95%
jan 1, 2006
0.169
-0.754
-81.68%
jan 1, 2007
3.487
+3.318
1.96K%
jan 1, 2008
2.847
-0.64
-18.36%
jan 1, 2009
2.286
-0.561
-19.69%
jan 1, 2010
1.809
-0.477
-20.89%
jan 1, 2011
1.936
+0.128
7.06%
jan 1, 2012
2.768
+0.832
42.97%
jan 1, 2013
2.496
-0.273
-9.84%
jan 1, 2014
2.592
+0.097
3.87%
jan 1, 2015
2.192
-0.4
-15.43%
Ranking of countries by current statistics by years