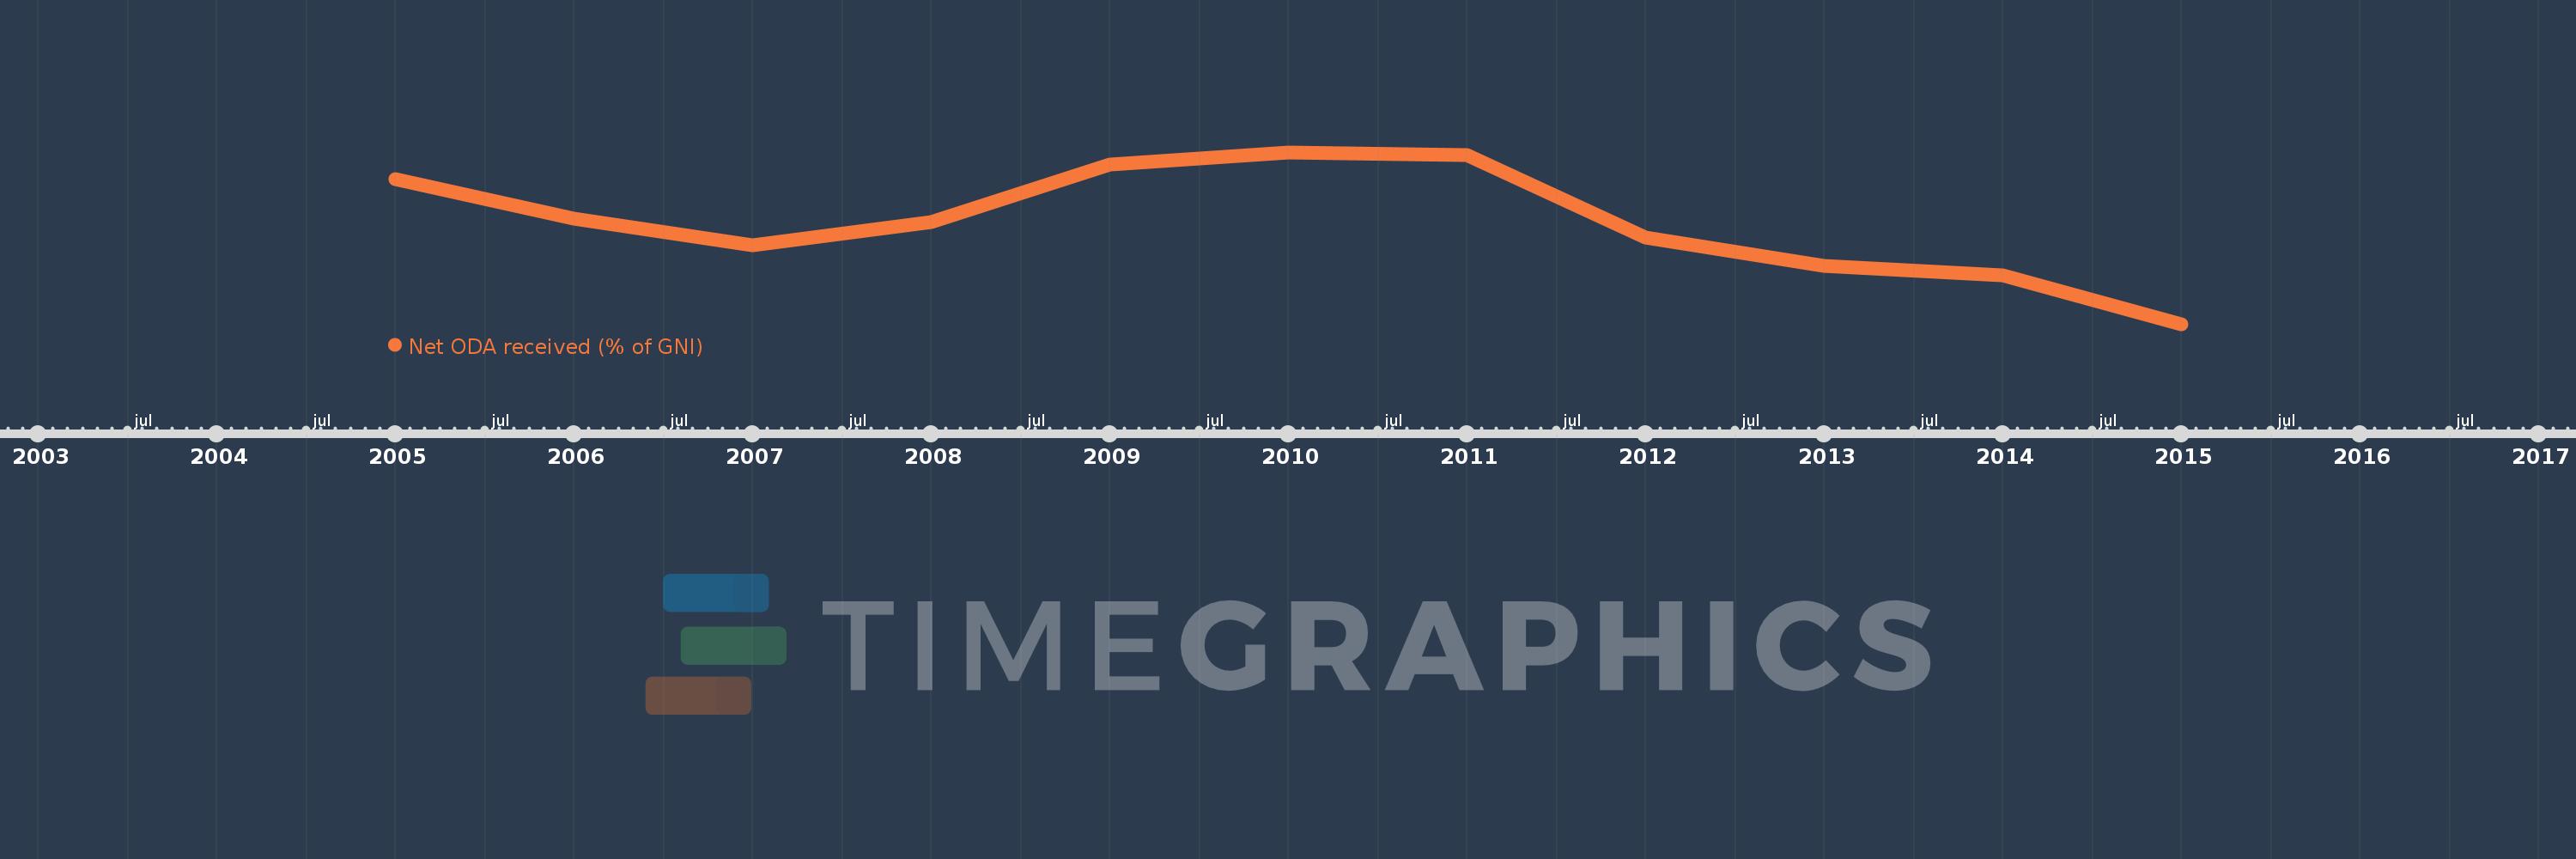
This timeline shows a graph from 2005 to 2015 of Other small states. No data until 2004. Number of actual observations by date: 11.
Source name:
World Development Indicators
Source organization:
Development Assistance Committee of the Organisation for Economic Co-operation and Development, Geographical Distribution of Financial Flows to Developing Countries, Development Co-operation Report, and International Development Statistics database. Data are available online at: www.oecd.org/dac/stats/idsonline. World Bank GNI estimates are used for the denominator.
Categories, topics:
Aid Effectiveness, Economy & Growth, External Debt
Last updated:
apr 23, 2017
Indicators value changes by year
Meaning:
0.709
Minimum:
0.454
jan 1, 2015
Maximum:
0.881
jan 1, 2010
At the date of observation
Value
Absolute change
Change from the previous value
jan 1, 2005
0.815
+0.815
0.0%
jan 1, 2006
0.717
-0.098
-12.08%
jan 1, 2007
0.651
-0.066
-9.23%
jan 1, 2008
0.707
+0.056
8.64%
jan 1, 2009
0.85
+0.143
20.23%
jan 1, 2010
0.881
+0.031
3.63%
jan 1, 2011
0.875
-0.006
-0.71%
jan 1, 2012
0.669
-0.205
-23.44%
jan 1, 2013
0.6
-0.069
-10.38%
jan 1, 2014
0.576
-0.024
-3.96%
jan 1, 2015
0.454
-0.122
-21.25%
Ranking of countries by current statistics by years