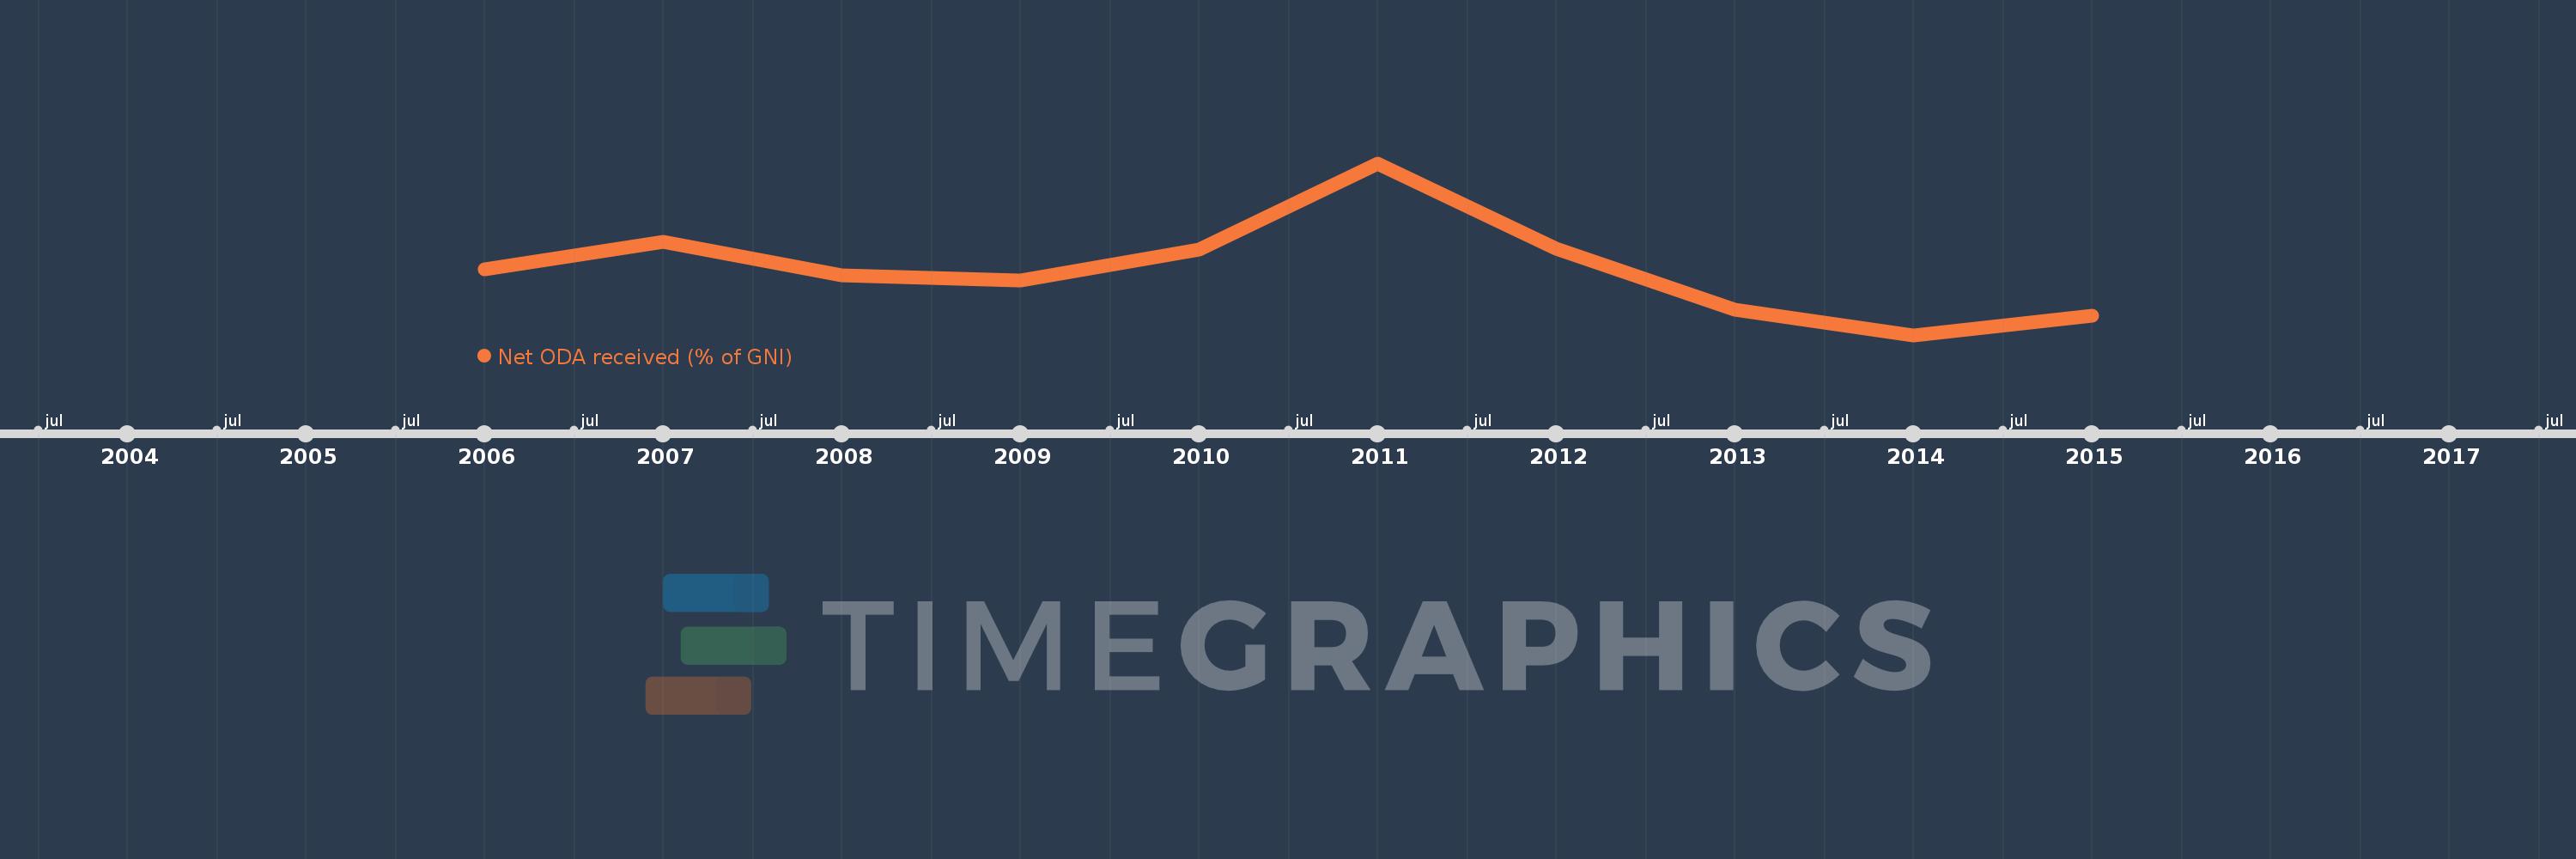
This timeline shows a graph from 2006 to 2015 of Belarus. No data until 2005. Number of actual observations by date: 10.
Source name:
World Development Indicators
Source organization:
Development Assistance Committee of the Organisation for Economic Co-operation and Development, Geographical Distribution of Financial Flows to Developing Countries, Development Co-operation Report, and International Development Statistics database. Data are available online at: www.oecd.org/dac/stats/idsonline. World Bank GNI estimates are used for the denominator.
Categories, topics:
Aid Effectiveness, Economy & Growth, External Debt
Last updated:
apr 23, 2017
Indicators value changes by year
Meaning:
0.191
Minimum:
0.15
jan 1, 2014
Maximum:
0.257
jan 1, 2011
At the date of observation
Value
Absolute change
Change from the previous value
jan 1, 2006
0.191
+0.191
0.0%
jan 1, 2007
0.208
+0.017
8.72%
jan 1, 2008
0.187
-0.021
-10.1%
jan 1, 2009
0.184
-0.003
-1.37%
jan 1, 2010
0.203
+0.019
10.27%
jan 1, 2011
0.257
+0.053
26.34%
jan 1, 2012
0.204
-0.053
-20.64%
jan 1, 2013
0.166
-0.038
-18.52%
jan 1, 2014
0.15
-0.016
-9.69%
jan 1, 2015
0.162
+0.012
8.29%
Ranking of countries by current statistics by years