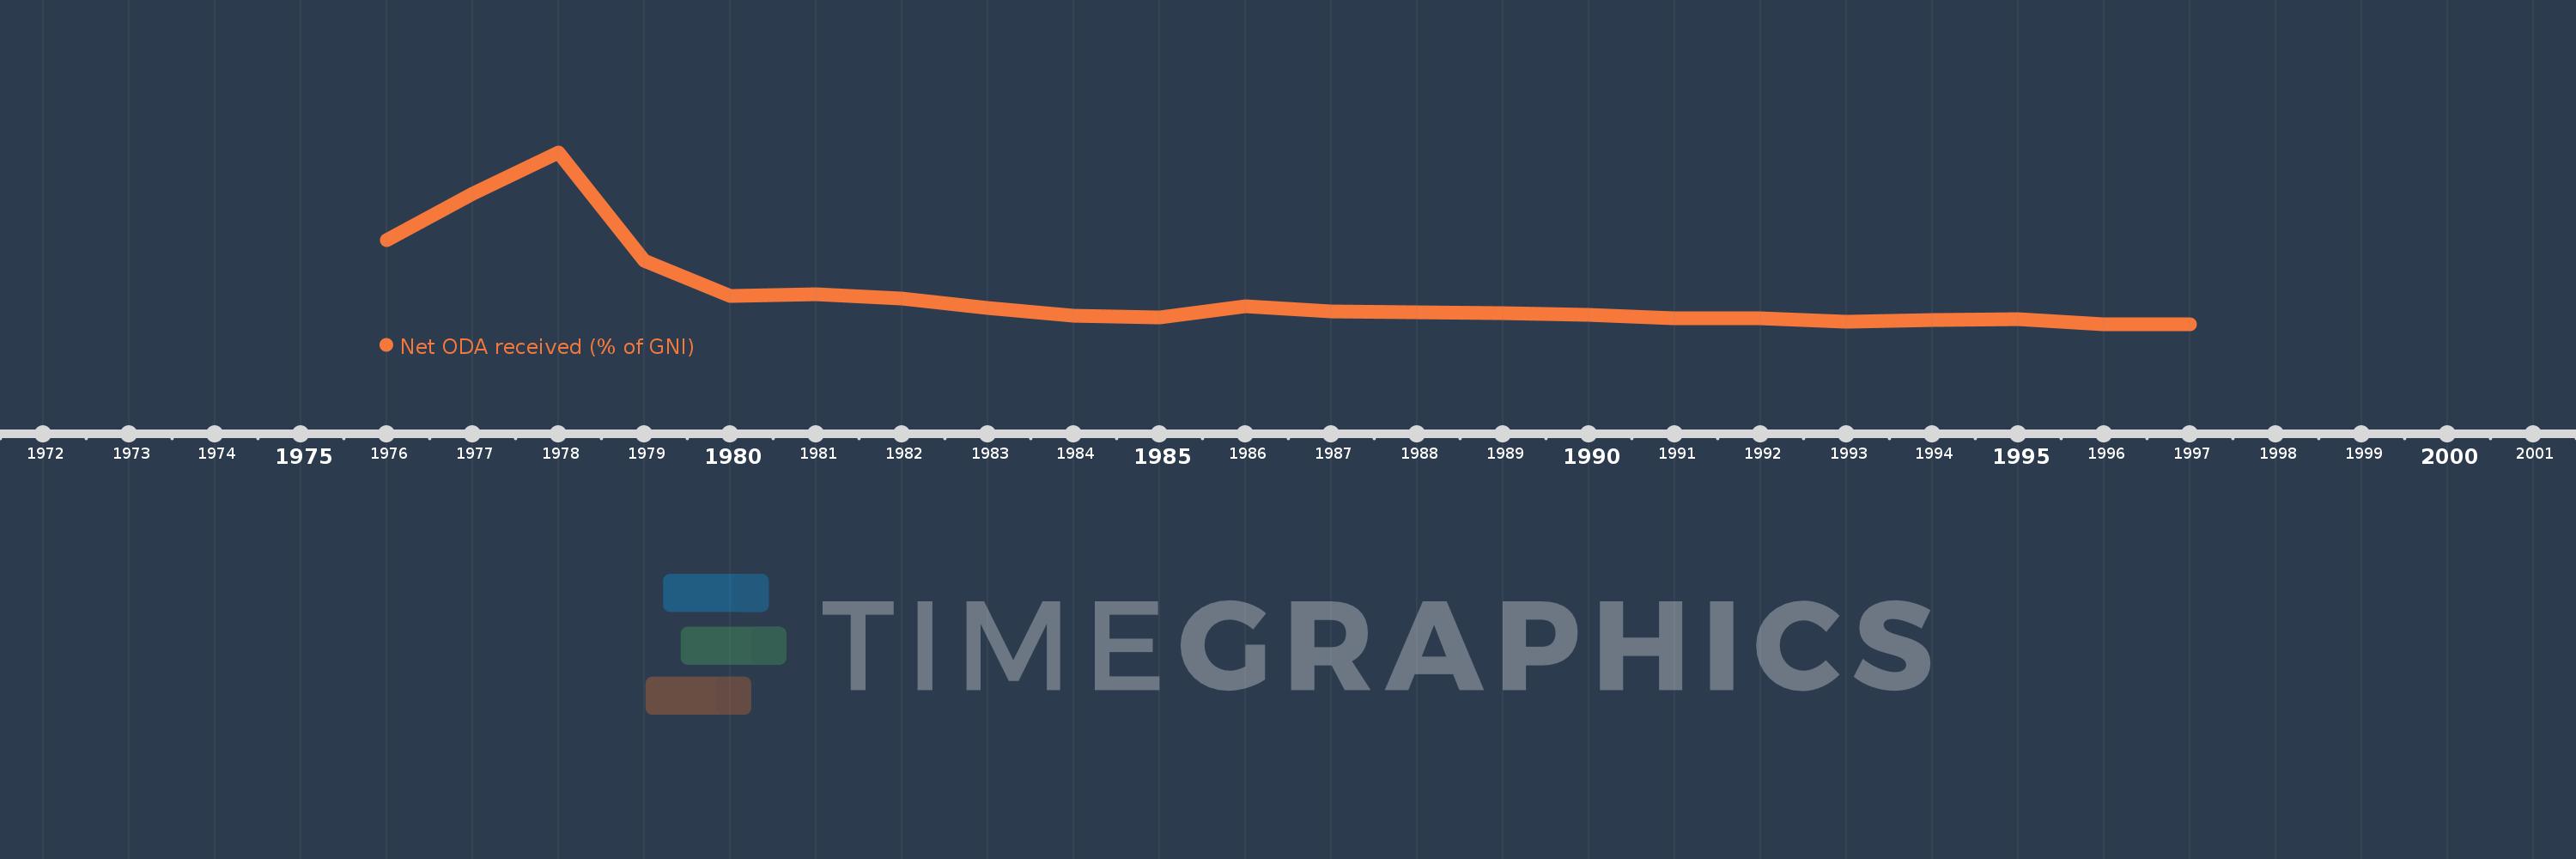
This timeline shows a graph from 1976 to 1997 of Cyprus. No data until 1975. Number of actual observations by date: 22.
Source name:
World Development Indicators
Source organization:
Development Assistance Committee of the Organisation for Economic Co-operation and Development, Geographical Distribution of Financial Flows to Developing Countries, Development Co-operation Report, and International Development Statistics database. Data are available online at: www.oecd.org/dac/stats/idsonline. World Bank GNI estimates are used for the denominator.
Categories, topics:
Aid Effectiveness, Economy & Growth, External Debt
Last updated:
apr 23, 2017
Indicators value changes by year
Meaning:
2.373
Minimum:
0.223
jan 1, 1996
Maximum:
12.674
jan 1, 1978
At the date of observation
Value
Absolute change
Change from the previous value
jan 1, 1976
6.309
+6.309
0.0%
jan 1, 1977
9.678
+3.369
53.4%
jan 1, 1978
12.674
+2.996
30.95%
jan 1, 1979
4.848
-7.826
-61.75%
jan 1, 1980
2.29
-2.557
-52.75%
jan 1, 1981
2.407
+0.117
5.11%
jan 1, 1982
2.071
-0.336
-13.96%
jan 1, 1983
1.413
-0.658
-31.77%
jan 1, 1984
0.86
-0.554
-39.16%
jan 1, 1985
0.737
-0.123
-14.29%
jan 1, 1986
1.512
+0.775
105.12%
jan 1, 1987
1.13
-0.382
-25.25%
jan 1, 1988
1.1
-0.029
-2.6%
jan 1, 1989
1.02
-0.081
-7.33%
jan 1, 1990
0.879
-0.141
-13.81%
jan 1, 1991
0.676
-0.203
-23.05%
jan 1, 1992
0.678
+0.001
0.2%
jan 1, 1993
0.374
-0.304
-44.83%
jan 1, 1994
0.506
+0.132
35.21%
jan 1, 1995
0.586
+0.081
15.97%
jan 1, 1996
0.223
-0.363
-61.89%
jan 1, 1997
0.233
+0.01
4.47%
Ranking of countries by current statistics by years