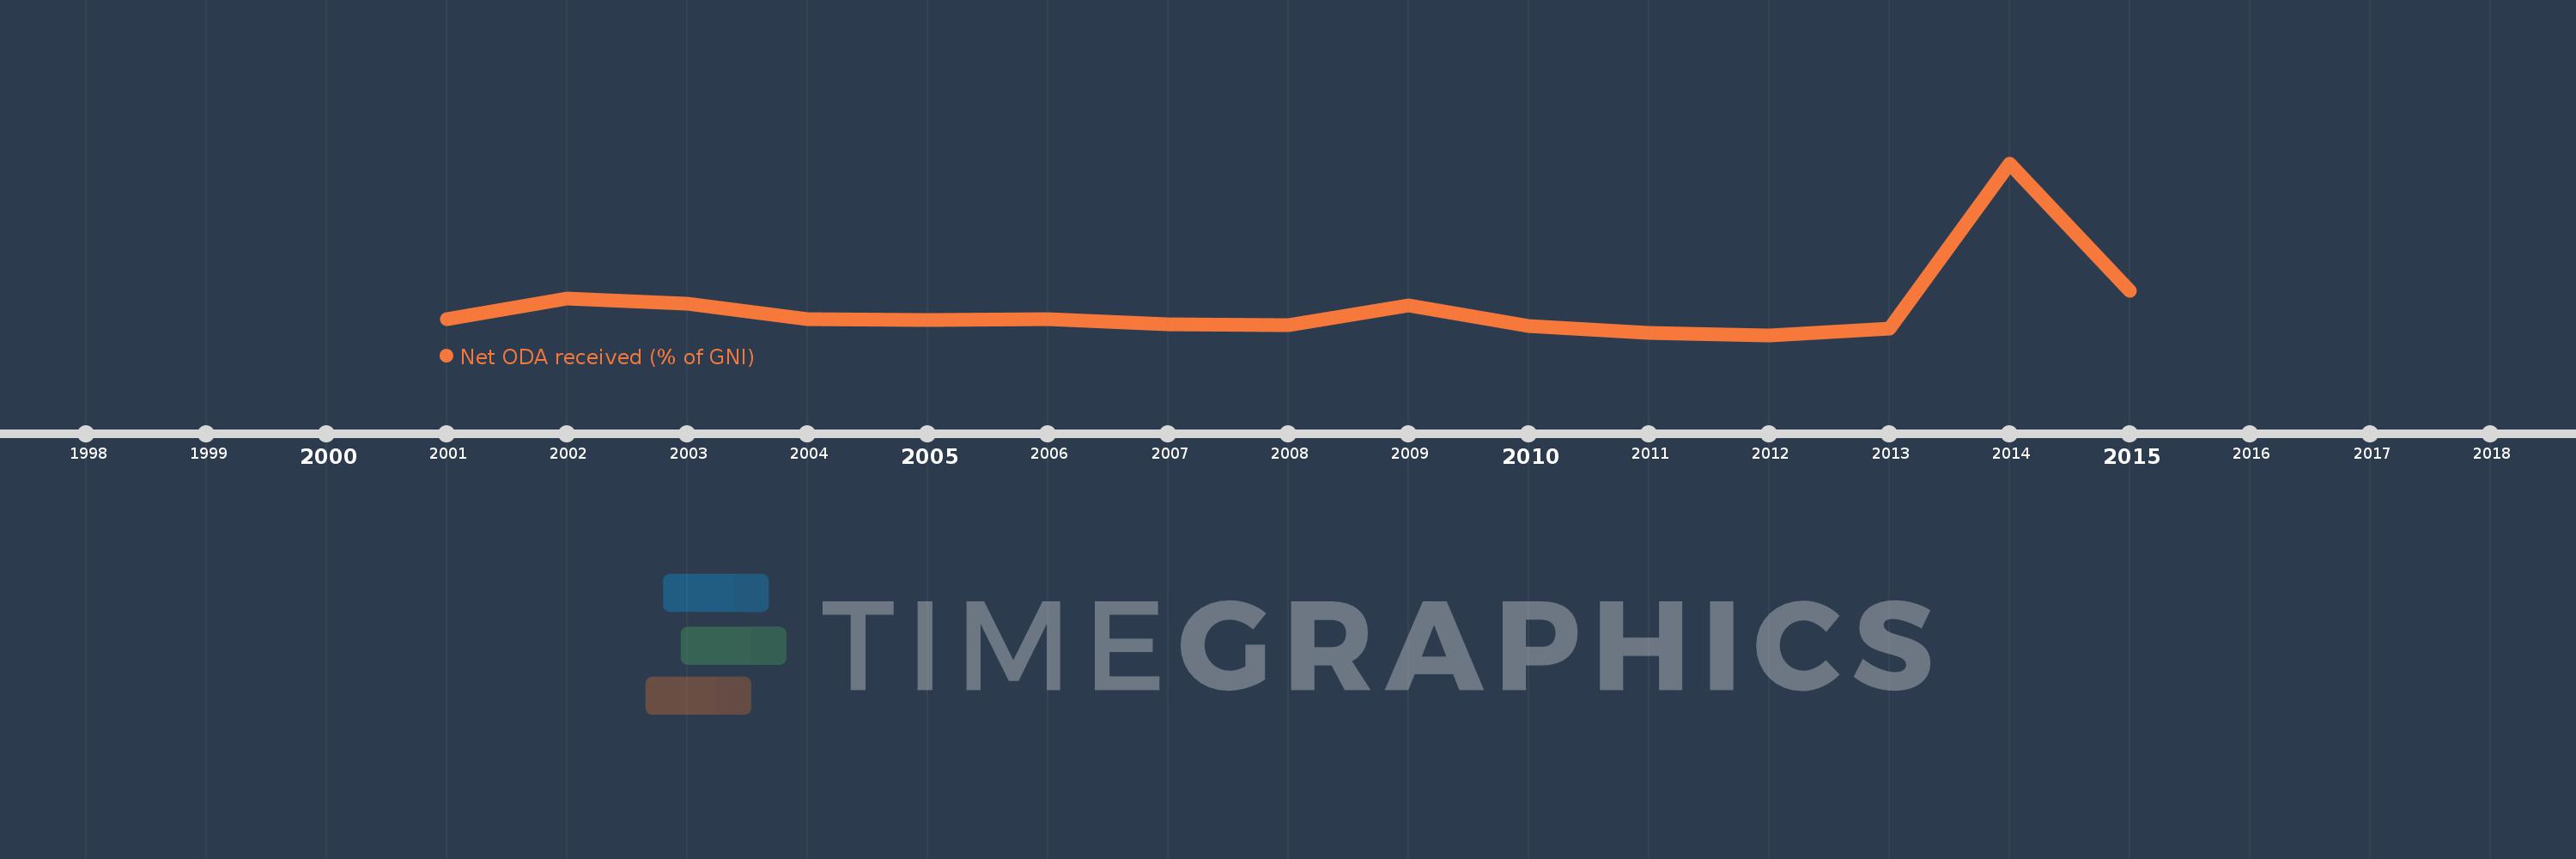
This timeline shows a graph from 2001 to 2015 of Myanmar. No data until 2000. Number of actual observations by date: 15.
Source name:
World Development Indicators
Source organization:
Development Assistance Committee of the Organisation for Economic Co-operation and Development, Geographical Distribution of Financial Flows to Developing Countries, Development Co-operation Report, and International Development Statistics database. Data are available online at: www.oecd.org/dac/stats/idsonline. World Bank GNI estimates are used for the denominator.
Categories, topics:
Aid Effectiveness, Economy & Growth, External Debt
Last updated:
apr 23, 2017
Indicators value changes by year
Meaning:
1.617
Minimum:
0.634
jan 1, 2012
Maximum:
6.758
jan 1, 2014
At the date of observation
Value
Absolute change
Change from the previous value
jan 1, 2001
1.187
+1.187
0.0%
jan 1, 2002
1.942
+0.755
63.64%
jan 1, 2003
1.757
-0.184
-9.5%
jan 1, 2004
1.195
-0.562
-32.0%
jan 1, 2005
1.169
-0.026
-2.2%
jan 1, 2006
1.209
+0.04
3.44%
jan 1, 2007
1.005
-0.204
-16.86%
jan 1, 2008
0.971
-0.034
-3.41%
jan 1, 2009
1.678
+0.707
72.83%
jan 1, 2010
0.964
-0.714
-42.52%
jan 1, 2011
0.716
-0.248
-25.72%
jan 1, 2012
0.634
-0.083
-11.52%
jan 1, 2013
0.87
+0.236
37.23%
jan 1, 2014
6.758
+5.889
677.08%
jan 1, 2015
2.196
-4.563
-67.51%
Ranking of countries by current statistics by years