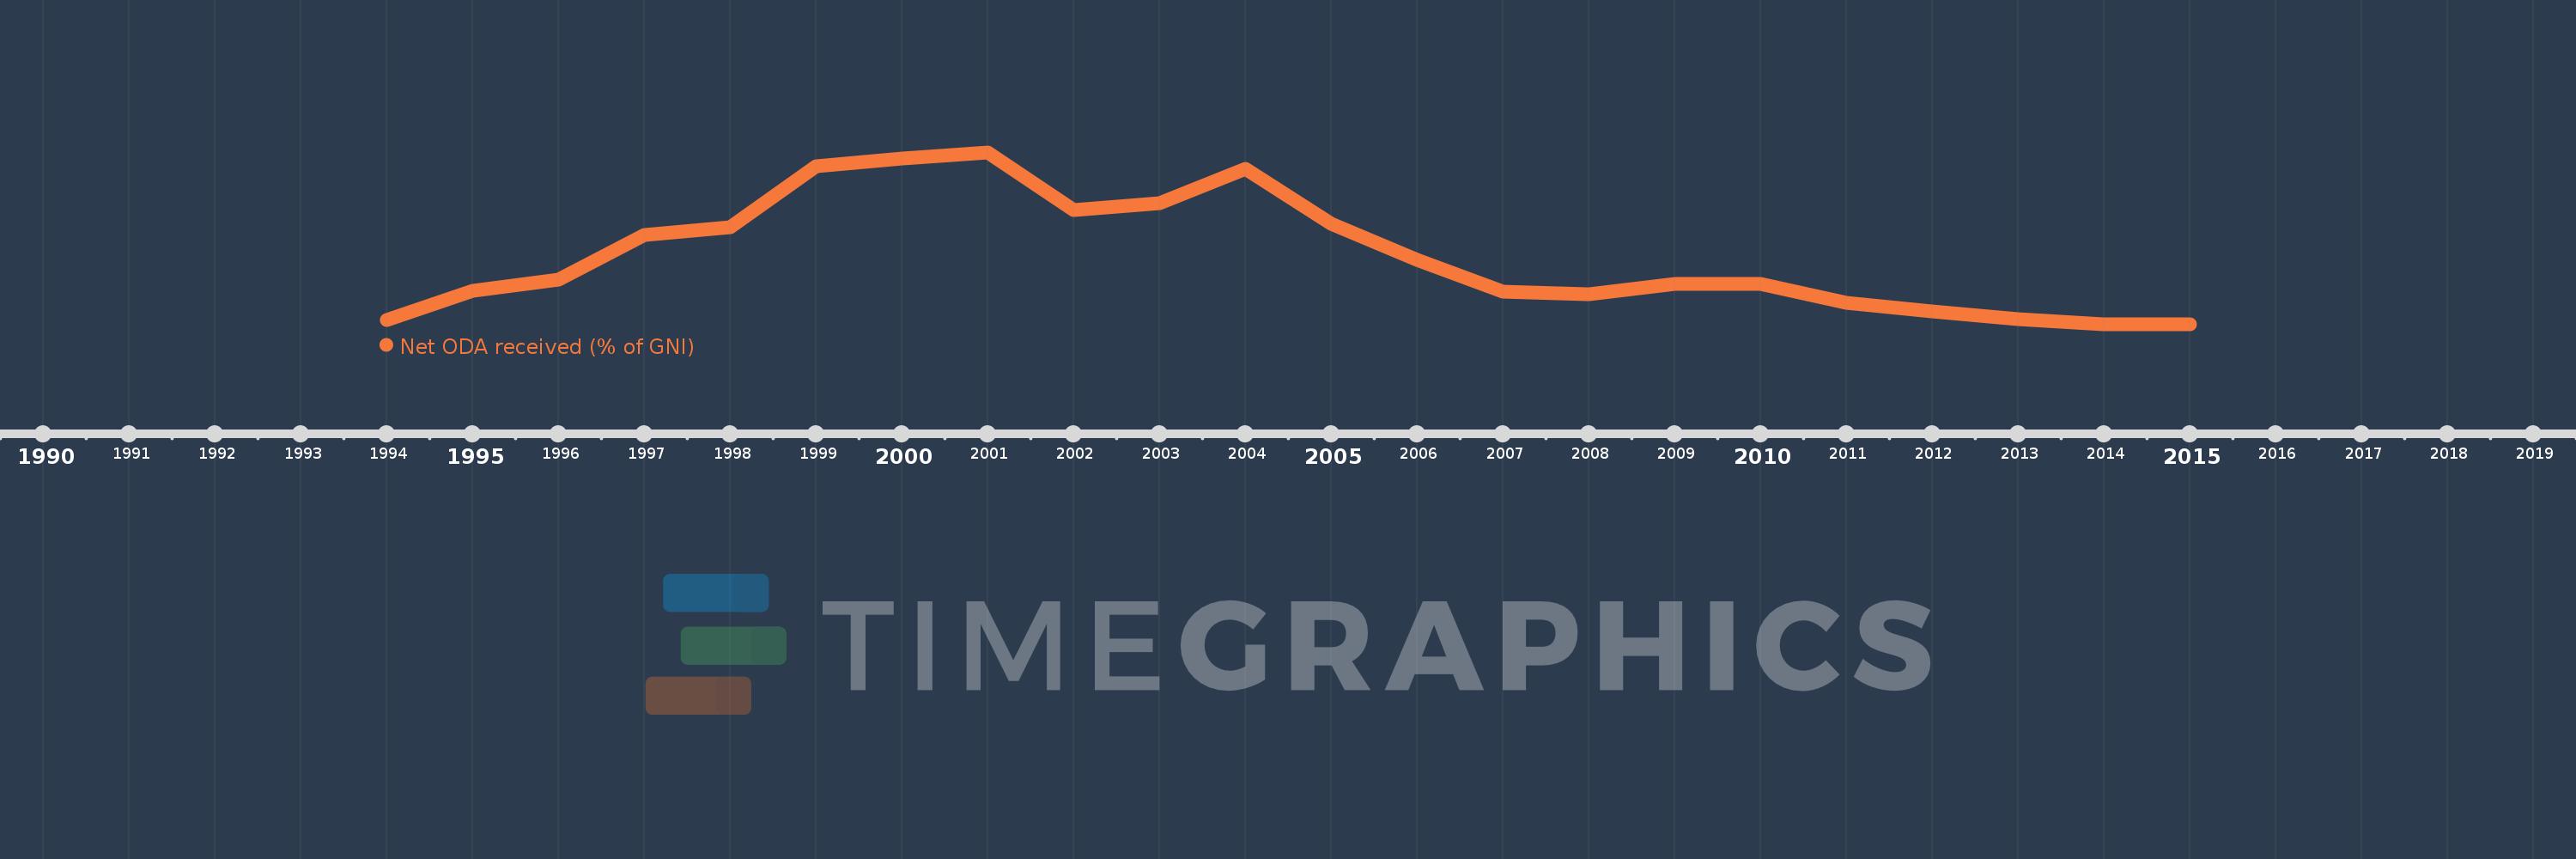
This timeline shows a graph from 1994 to 2015 of Kazakhstan. No data until 1993. Number of actual observations by date: 22.
Source name:
World Development Indicators
Source organization:
Development Assistance Committee of the Organisation for Economic Co-operation and Development, Geographical Distribution of Financial Flows to Developing Countries, Development Co-operation Report, and International Development Statistics database. Data are available online at: www.oecd.org/dac/stats/idsonline. World Bank GNI estimates are used for the denominator.
Categories, topics:
Aid Effectiveness, Economy & Growth, External Debt
Last updated:
apr 23, 2017
Indicators value changes by year
Meaning:
0.467
Minimum:
0.042
jan 1, 2014
Maximum:
1.11
jan 1, 2001
At the date of observation
Value
Absolute change
Change from the previous value
jan 1, 1994
0.066
+0.066
0.0%
jan 1, 1995
0.252
+0.186
283.28%
jan 1, 1996
0.32
+0.069
27.27%
jan 1, 1997
0.598
+0.277
86.56%
jan 1, 1998
0.646
+0.048
8.04%
jan 1, 1999
1.023
+0.377
58.33%
jan 1, 2000
1.073
+0.051
4.95%
jan 1, 2001
1.11
+0.037
3.45%
jan 1, 2002
0.751
-0.36
-32.4%
jan 1, 2003
0.797
+0.047
6.21%
jan 1, 2004
1.01
+0.213
26.72%
jan 1, 2005
0.665
-0.346
-34.22%
jan 1, 2006
0.442
-0.222
-33.46%
jan 1, 2007
0.244
-0.199
-44.91%
jan 1, 2008
0.229
-0.014
-5.82%
jan 1, 2009
0.294
+0.065
28.12%
jan 1, 2010
0.29
-0.004
-1.43%
jan 1, 2011
0.176
-0.114
-39.28%
jan 1, 2012
0.122
-0.054
-30.57%
jan 1, 2013
0.072
-0.051
-41.45%
jan 1, 2014
0.042
-0.03
-41.68%
jan 1, 2015
0.044
+0.003
6.66%
Ranking of countries by current statistics by years