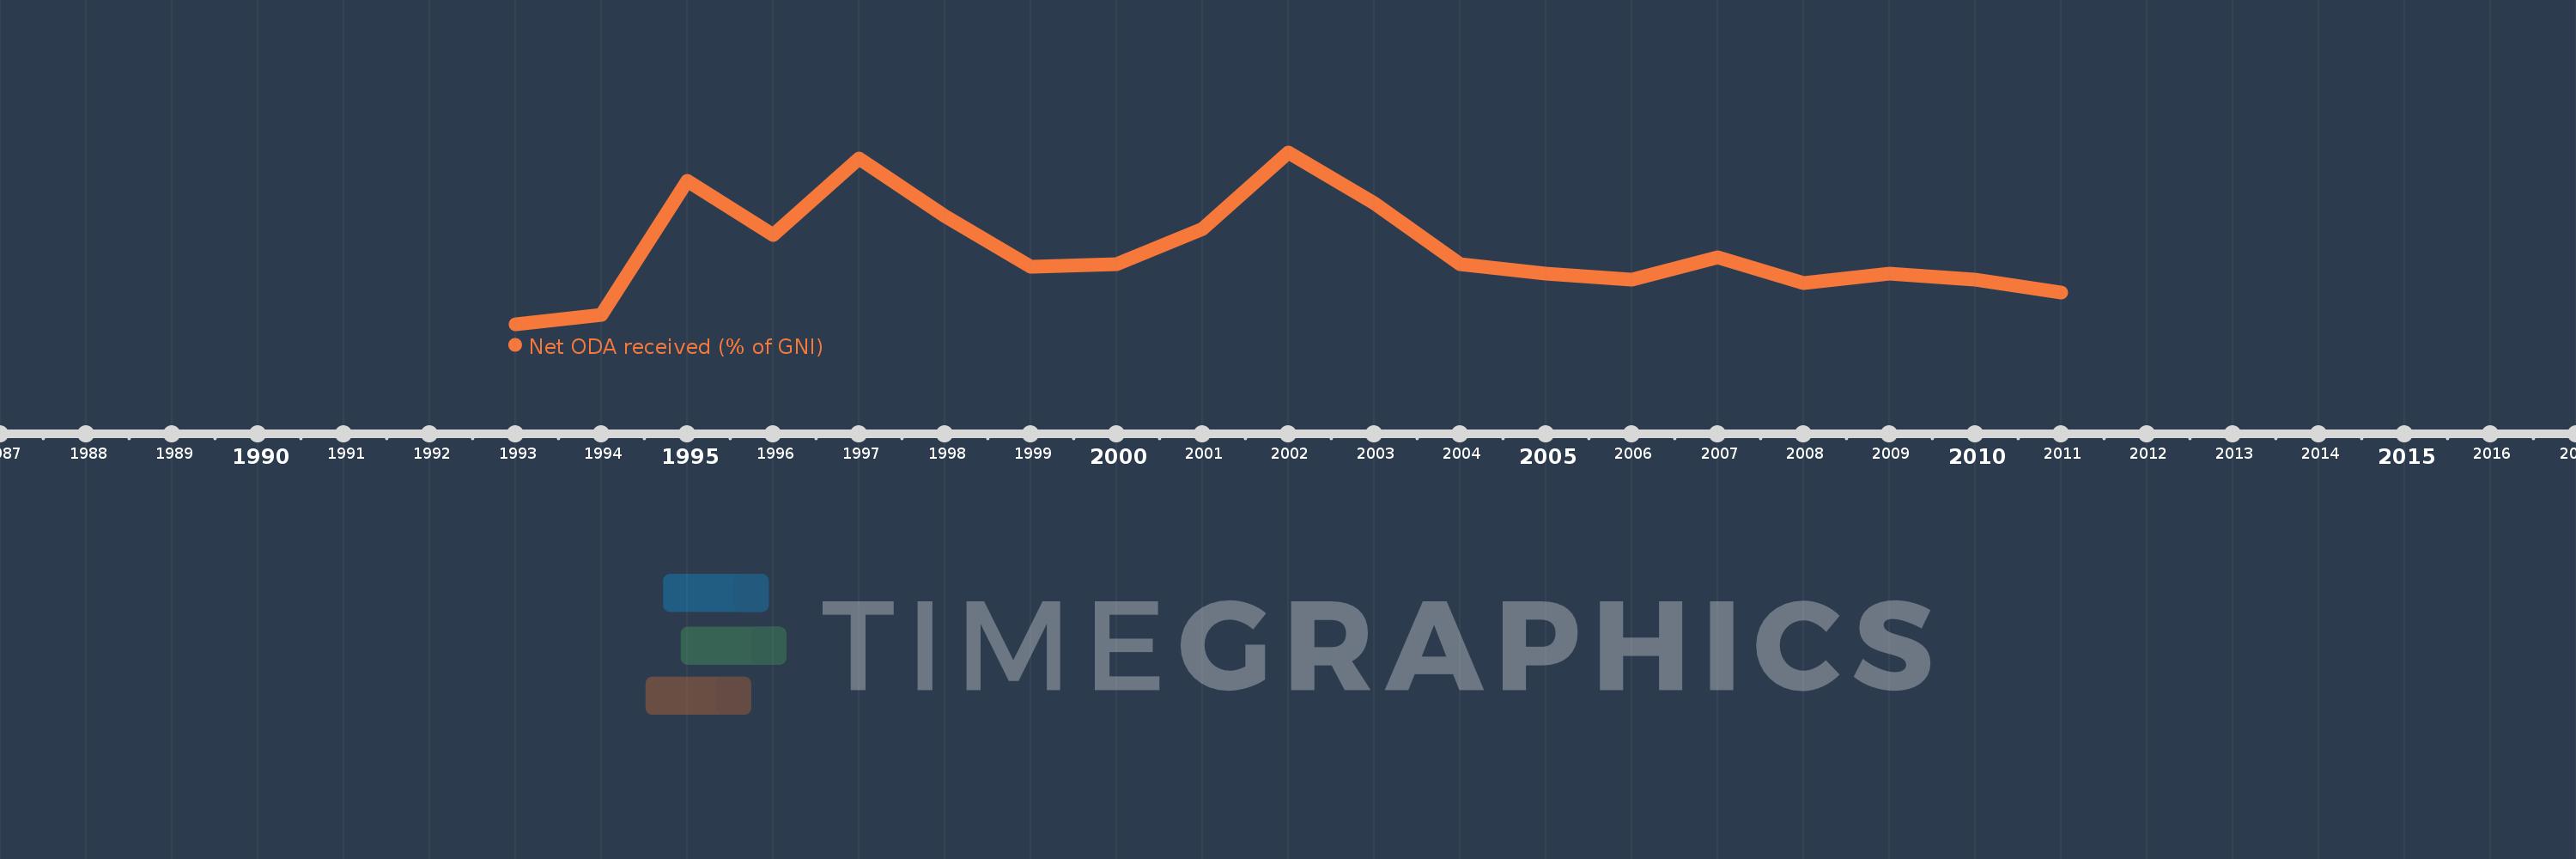
This timeline shows a graph from 1993 to 2011 of Central Europe and the Baltics. No data until 1992. Number of actual observations by date: 19.
Source name:
World Development Indicators
Source organization:
Development Assistance Committee of the Organisation for Economic Co-operation and Development, Geographical Distribution of Financial Flows to Developing Countries, Development Co-operation Report, and International Development Statistics database. Data are available online at: www.oecd.org/dac/stats/idsonline. World Bank GNI estimates are used for the denominator.
Categories, topics:
Aid Effectiveness, Economy & Growth, External Debt
Last updated:
apr 23, 2017
Indicators value changes by year
Meaning:
0.023
Minimum:
0.0
jan 1, 1993
Maximum:
0.054
jan 1, 2002
At the date of observation
Value
Absolute change
Change from the previous value
jan 1, 1993
0.0
+0.0
0.0%
jan 1, 1994
0.003
+0.003
67.0K%
jan 1, 1995
0.045
+0.043
1.63K%
jan 1, 1996
0.028
-0.018
-39.19%
jan 1, 1997
0.052
+0.025
90.27%
jan 1, 1998
0.034
-0.019
-35.55%
jan 1, 1999
0.018
-0.016
-47.24%
jan 1, 2000
0.019
+0.001
4.03%
jan 1, 2001
0.03
+0.011
60.68%
jan 1, 2002
0.054
+0.024
80.17%
jan 1, 2003
0.038
-0.016
-30.13%
jan 1, 2004
0.019
-0.018
-48.13%
jan 1, 2005
0.016
-0.003
-16.33%
jan 1, 2006
0.014
-0.002
-11.87%
jan 1, 2007
0.021
+0.007
46.72%
jan 1, 2008
0.013
-0.008
-35.96%
jan 1, 2009
0.016
+0.003
21.89%
jan 1, 2010
0.014
-0.003
-17.03%
jan 1, 2011
0.01
-0.003
-23.79%
Ranking of countries by current statistics by years