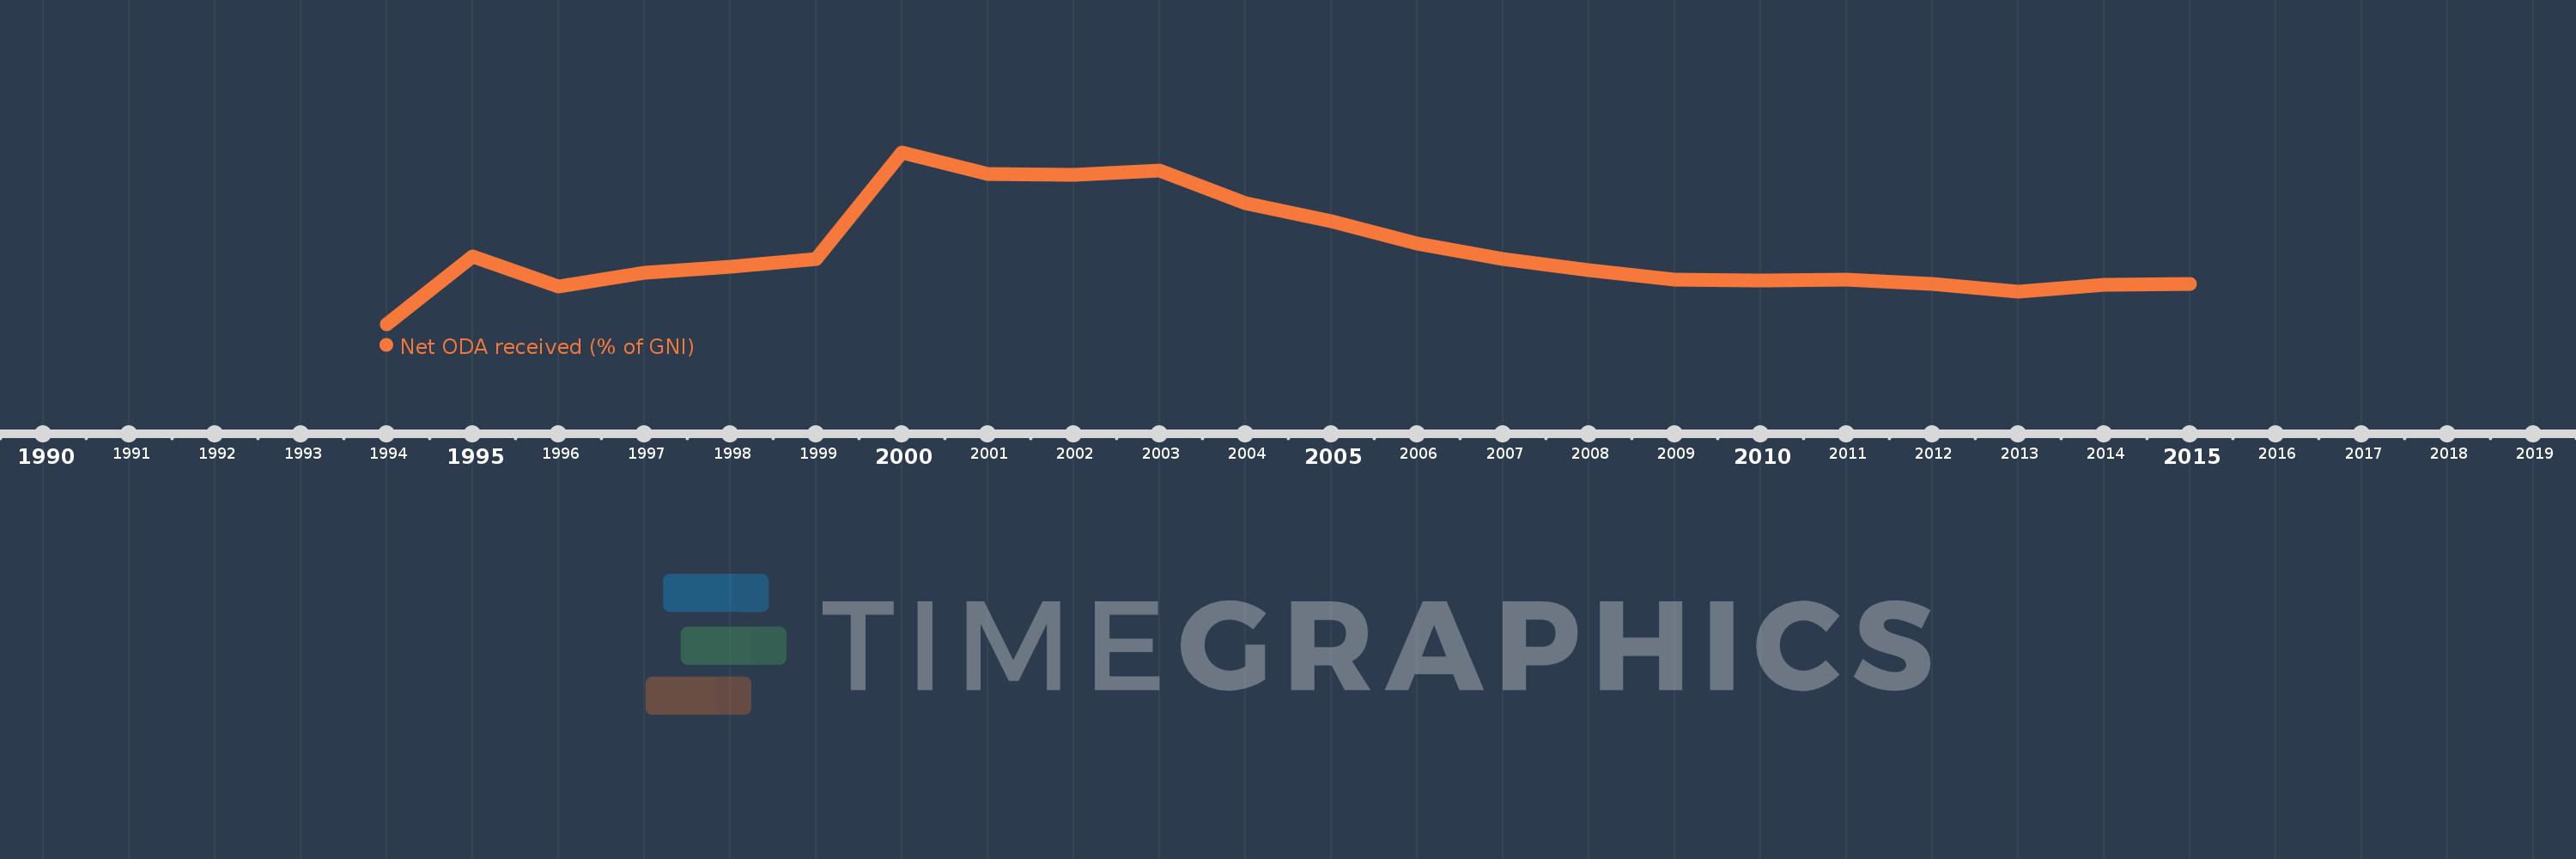
This timeline shows a graph from 1994 to 2015 of Macedonia, FYR. No data until 1993. Number of actual observations by date: 22.
Source name:
World Development Indicators
Source organization:
Development Assistance Committee of the Organisation for Economic Co-operation and Development, Geographical Distribution of Financial Flows to Developing Countries, Development Co-operation Report, and International Development Statistics database. Data are available online at: www.oecd.org/dac/stats/idsonline. World Bank GNI estimates are used for the denominator.
Categories, topics:
Aid Effectiveness, Economy & Growth, External Debt
Last updated:
apr 23, 2017
Indicators value changes by year
Meaning:
3.361
Minimum:
0.133
jan 1, 1994
Maximum:
7.687
jan 1, 2000
At the date of observation
Value
Absolute change
Change from the previous value
jan 1, 1994
0.133
+0.133
0.0%
jan 1, 1995
3.127
+2.993
2.25K%
jan 1, 1996
1.787
-1.34
-42.85%
jan 1, 1997
2.411
+0.624
34.94%
jan 1, 1998
2.67
+0.259
10.73%
jan 1, 1999
2.982
+0.312
11.7%
jan 1, 2000
7.687
+4.705
157.75%
jan 1, 2001
6.757
-0.931
-12.11%
jan 1, 2002
6.713
-0.044
-0.65%
jan 1, 2003
6.885
+0.172
2.57%
jan 1, 2004
5.438
-1.447
-21.02%
jan 1, 2005
4.665
-0.773
-14.22%
jan 1, 2006
3.696
-0.969
-20.76%
jan 1, 2007
3.003
-0.693
-18.74%
jan 1, 2008
2.526
-0.478
-15.9%
jan 1, 2009
2.091
-0.435
-17.21%
jan 1, 2010
2.062
-0.029
-1.4%
jan 1, 2011
2.079
+0.017
0.82%
jan 1, 2012
1.887
-0.192
-9.22%
jan 1, 2013
1.57
-0.317
-16.8%
jan 1, 2014
1.867
+0.297
18.94%
jan 1, 2015
1.898
+0.03
1.62%
Ranking of countries by current statistics by years