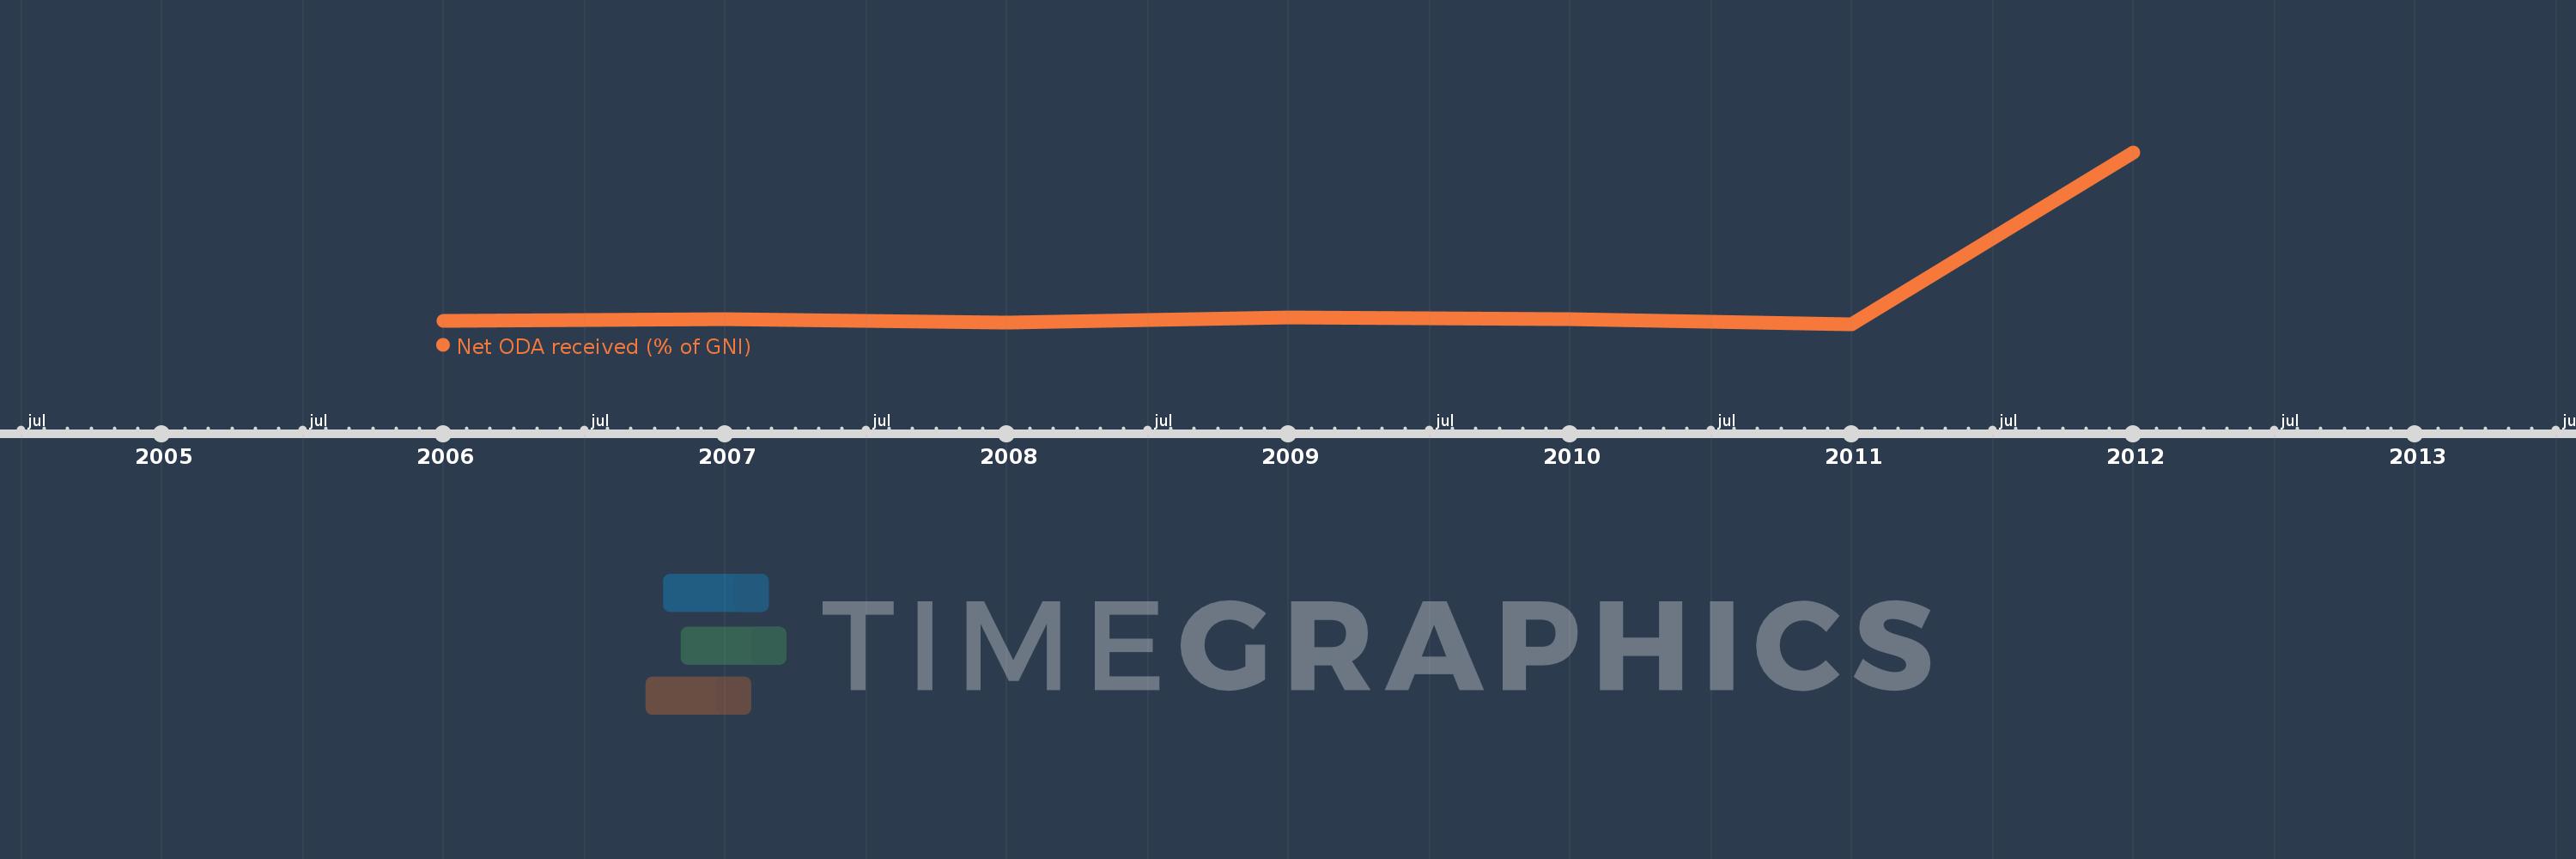
This timeline shows a graph from 2006 to 2012 of Libya. No data until 2005. Number of actual observations by date: 7.
Source name:
World Development Indicators
Source organization:
Development Assistance Committee of the Organisation for Economic Co-operation and Development, Geographical Distribution of Financial Flows to Developing Countries, Development Co-operation Report, and International Development Statistics database. Data are available online at: www.oecd.org/dac/stats/idsonline. World Bank GNI estimates are used for the denominator.
Categories, topics:
Aid Effectiveness, Economy & Growth, External Debt
Last updated:
apr 23, 2017
Indicators value changes by year
Meaning:
0.307
Minimum:
0.011
jan 1, 2011
Maximum:
1.845
jan 1, 2012
At the date of observation
Value
Absolute change
Change from the previous value
jan 1, 2006
0.051
+0.051
0.0%
jan 1, 2007
0.067
+0.017
32.86%
jan 1, 2008
0.028
-0.039
-57.7%
jan 1, 2009
0.084
+0.056
197.43%
jan 1, 2010
0.065
-0.02
-23.57%
jan 1, 2011
0.011
-0.053
-82.3%
jan 1, 2012
1.845
+1.833
16.04K%
Ranking of countries by current statistics by years