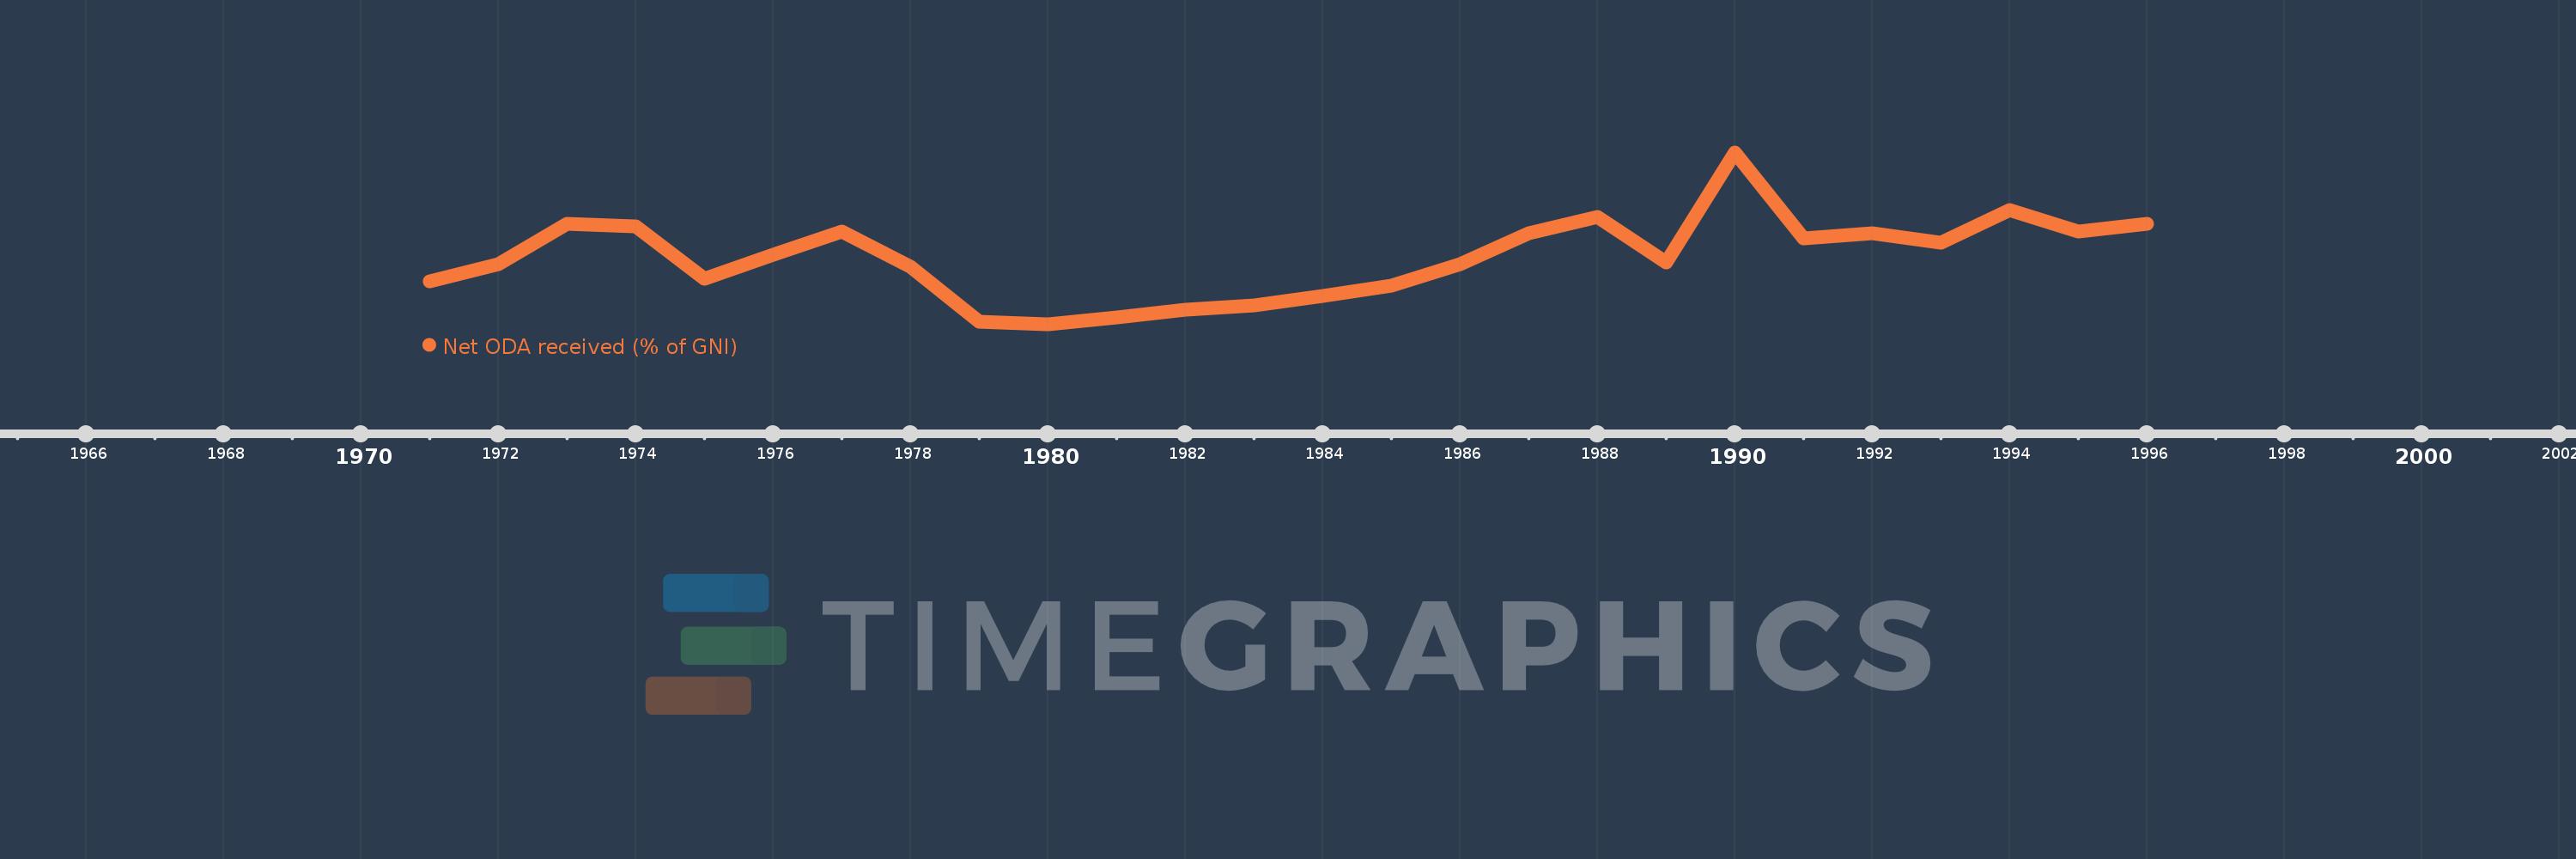
This timeline shows a graph from 1971 to 1996 of Qatar. No data until 1970. Number of actual observations by date: 26.
Source name:
World Development Indicators
Source organization:
Development Assistance Committee of the Organisation for Economic Co-operation and Development, Geographical Distribution of Financial Flows to Developing Countries, Development Co-operation Report, and International Development Statistics database. Data are available online at: www.oecd.org/dac/stats/idsonline. World Bank GNI estimates are used for the denominator.
Categories, topics:
Aid Effectiveness, Economy & Growth, External Debt
Last updated:
apr 23, 2017
Indicators value changes by year
Meaning:
0.031
Minimum:
0.003
jan 1, 1980
Maximum:
0.075
jan 1, 1990
At the date of observation
Value
Absolute change
Change from the previous value
jan 1, 1971
0.021
+0.021
0.0%
jan 1, 1972
0.028
+0.007
34.84%
jan 1, 1973
0.045
+0.017
59.04%
jan 1, 1974
0.044
-0.001
-2.63%
jan 1, 1975
0.022
-0.022
-50.35%
jan 1, 1976
0.032
+0.01
48.25%
jan 1, 1977
0.042
+0.01
30.31%
jan 1, 1978
0.027
-0.015
-36.53%
jan 1, 1979
0.004
-0.023
-85.47%
jan 1, 1980
0.003
-0.001
-14.55%
jan 1, 1981
0.006
+0.003
96.09%
jan 1, 1982
0.009
+0.003
43.27%
jan 1, 1983
0.011
+0.001
14.24%
jan 1, 1984
0.015
+0.005
43.56%
jan 1, 1985
0.019
+0.004
24.04%
jan 1, 1986
0.028
+0.009
47.16%
jan 1, 1987
0.041
+0.014
49.6%
jan 1, 1988
0.048
+0.006
15.38%
jan 1, 1989
0.029
-0.019
-39.56%
jan 1, 1990
0.075
+0.046
158.54%
jan 1, 1991
0.039
-0.035
-47.51%
jan 1, 1992
0.041
+0.001
3.79%
jan 1, 1993
0.037
-0.004
-8.73%
jan 1, 1994
0.051
+0.014
37.94%
jan 1, 1995
0.042
-0.009
-17.11%
jan 1, 1996
0.045
+0.002
5.25%
Ranking of countries by current statistics by years