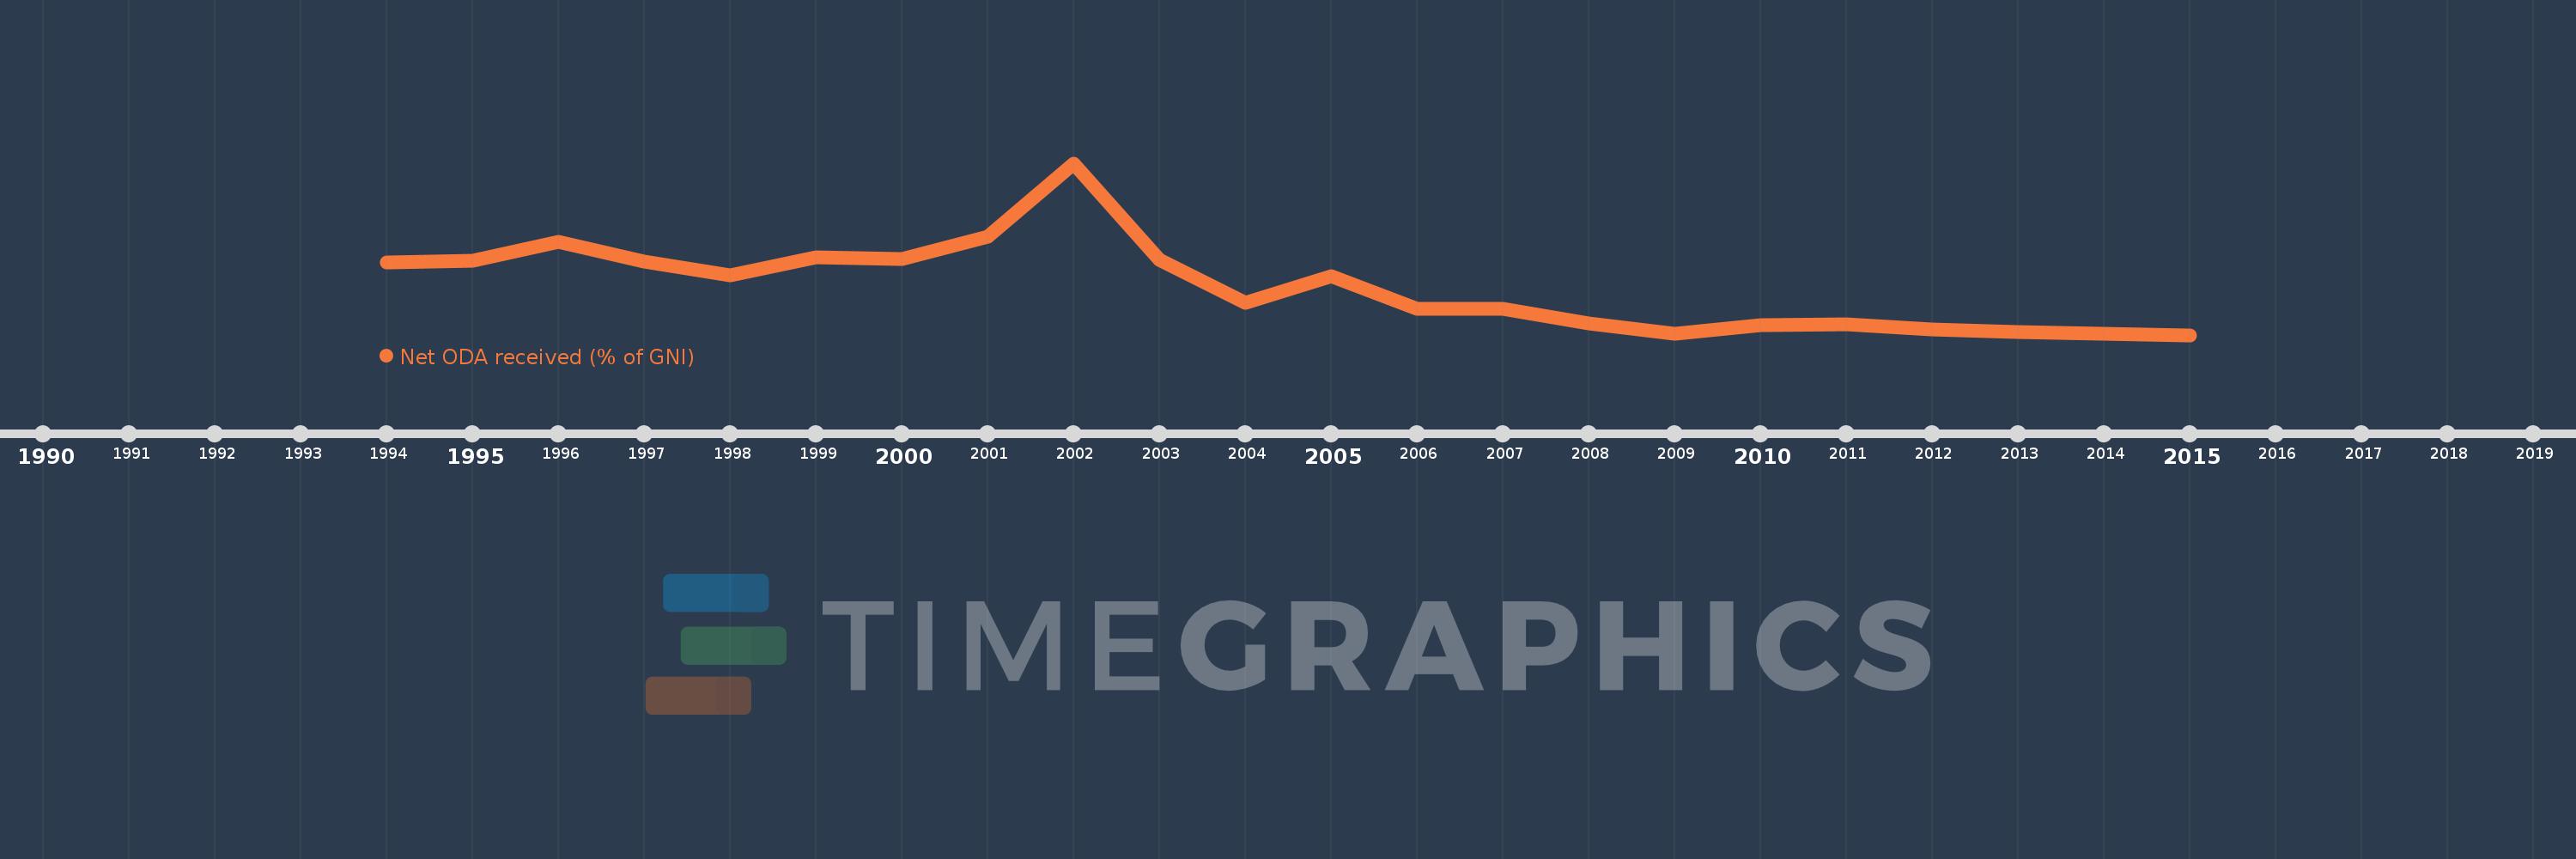
This timeline shows a graph from 1994 to 2015 of Turkmenistan. No data until 1993. Number of actual observations by date: 22.
Source name:
World Development Indicators
Source organization:
Development Assistance Committee of the Organisation for Economic Co-operation and Development, Geographical Distribution of Financial Flows to Developing Countries, Development Co-operation Report, and International Development Statistics database. Data are available online at: www.oecd.org/dac/stats/idsonline. World Bank GNI estimates are used for the denominator.
Categories, topics:
Aid Effectiveness, Economy & Growth, External Debt
Last updated:
apr 23, 2017
Indicators value changes by year
Meaning:
0.676
Minimum:
0.085
jan 1, 2015
Maximum:
2.194
jan 1, 2002
At the date of observation
Value
Absolute change
Change from the previous value
jan 1, 1994
0.971
+0.971
0.0%
jan 1, 1995
1.002
+0.031
3.2%
jan 1, 1996
1.228
+0.226
22.52%
jan 1, 1997
0.987
-0.241
-19.64%
jan 1, 1998
0.817
-0.17
-17.23%
jan 1, 1999
1.039
+0.222
27.22%
jan 1, 2000
1.022
-0.017
-1.66%
jan 1, 2001
1.294
+0.273
26.68%
jan 1, 2002
2.194
+0.9
69.54%
jan 1, 2003
1.008
-1.187
-54.08%
jan 1, 2004
0.484
-0.524
-51.96%
jan 1, 2005
0.806
+0.322
66.51%
jan 1, 2006
0.403
-0.403
-50.04%
jan 1, 2007
0.408
+0.005
1.32%
jan 1, 2008
0.232
-0.176
-43.25%
jan 1, 2009
0.099
-0.132
-57.06%
jan 1, 2010
0.21
+0.111
111.38%
jan 1, 2011
0.221
+0.011
5.27%
jan 1, 2012
0.153
-0.068
-30.77%
jan 1, 2013
0.118
-0.035
-22.8%
jan 1, 2014
0.101
-0.018
-14.82%
jan 1, 2015
0.085
-0.015
-15.37%
Ranking of countries by current statistics by years