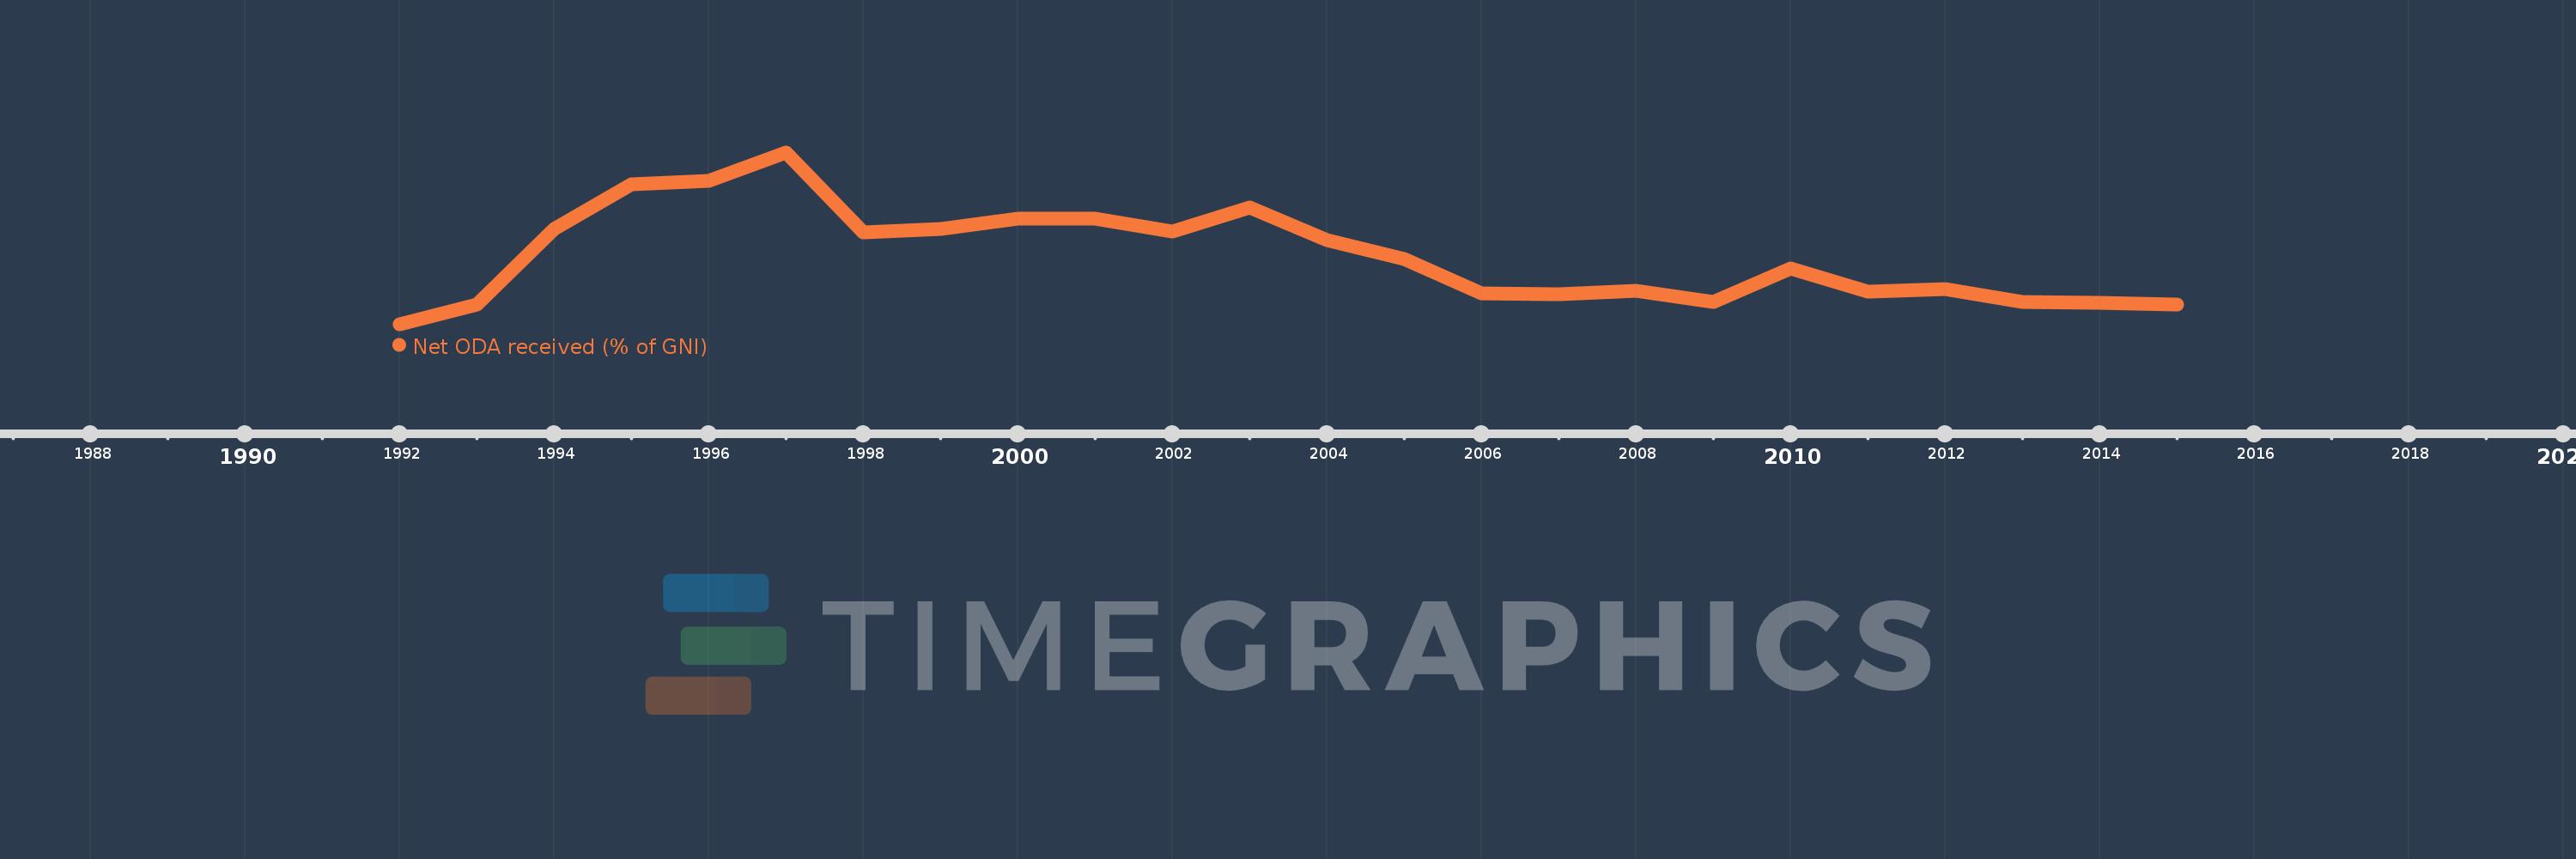
This timeline shows a graph from 1992 to 2015 of Armenia. No data until 1991. Number of actual observations by date: 24.
Source name:
World Development Indicators
Source organization:
Development Assistance Committee of the Organisation for Economic Co-operation and Development, Geographical Distribution of Financial Flows to Developing Countries, Development Co-operation Report, and International Development Statistics database. Data are available online at: www.oecd.org/dac/stats/idsonline. World Bank GNI estimates are used for the denominator.
Categories, topics:
Aid Effectiveness, Economy & Growth, External Debt
Last updated:
apr 23, 2017
Indicators value changes by year
Meaning:
7.128
Minimum:
0.132
jan 1, 1992
Maximum:
17.797
jan 1, 1997
At the date of observation
Value
Absolute change
Change from the previous value
jan 1, 1992
0.132
+0.132
0.0%
jan 1, 1993
2.111
+1.98
1.5K%
jan 1, 1994
9.928
+7.816
370.21%
jan 1, 1995
14.549
+4.622
46.55%
jan 1, 1996
14.838
+0.288
1.98%
jan 1, 1997
17.797
+2.959
19.94%
jan 1, 1998
9.556
-8.24
-46.3%
jan 1, 1999
9.938
+0.381
3.99%
jan 1, 2000
11.007
+1.069
10.76%
jan 1, 2001
10.99
-0.017
-0.16%
jan 1, 2002
9.695
-1.295
-11.78%
jan 1, 2003
12.156
+2.461
25.39%
jan 1, 2004
8.747
-3.409
-28.04%
jan 1, 2005
6.879
-1.868
-21.36%
jan 1, 2006
3.336
-3.543
-51.51%
jan 1, 2007
3.223
-0.113
-3.38%
jan 1, 2008
3.607
+0.384
11.91%
jan 1, 2009
2.45
-1.157
-32.08%
jan 1, 2010
5.84
+3.39
138.37%
jan 1, 2011
3.522
-2.318
-39.69%
jan 1, 2012
3.78
+0.258
7.32%
jan 1, 2013
2.456
-1.324
-35.03%
jan 1, 2014
2.363
-0.092
-3.76%
jan 1, 2015
2.184
-0.179
-7.59%
Ranking of countries by current statistics by years