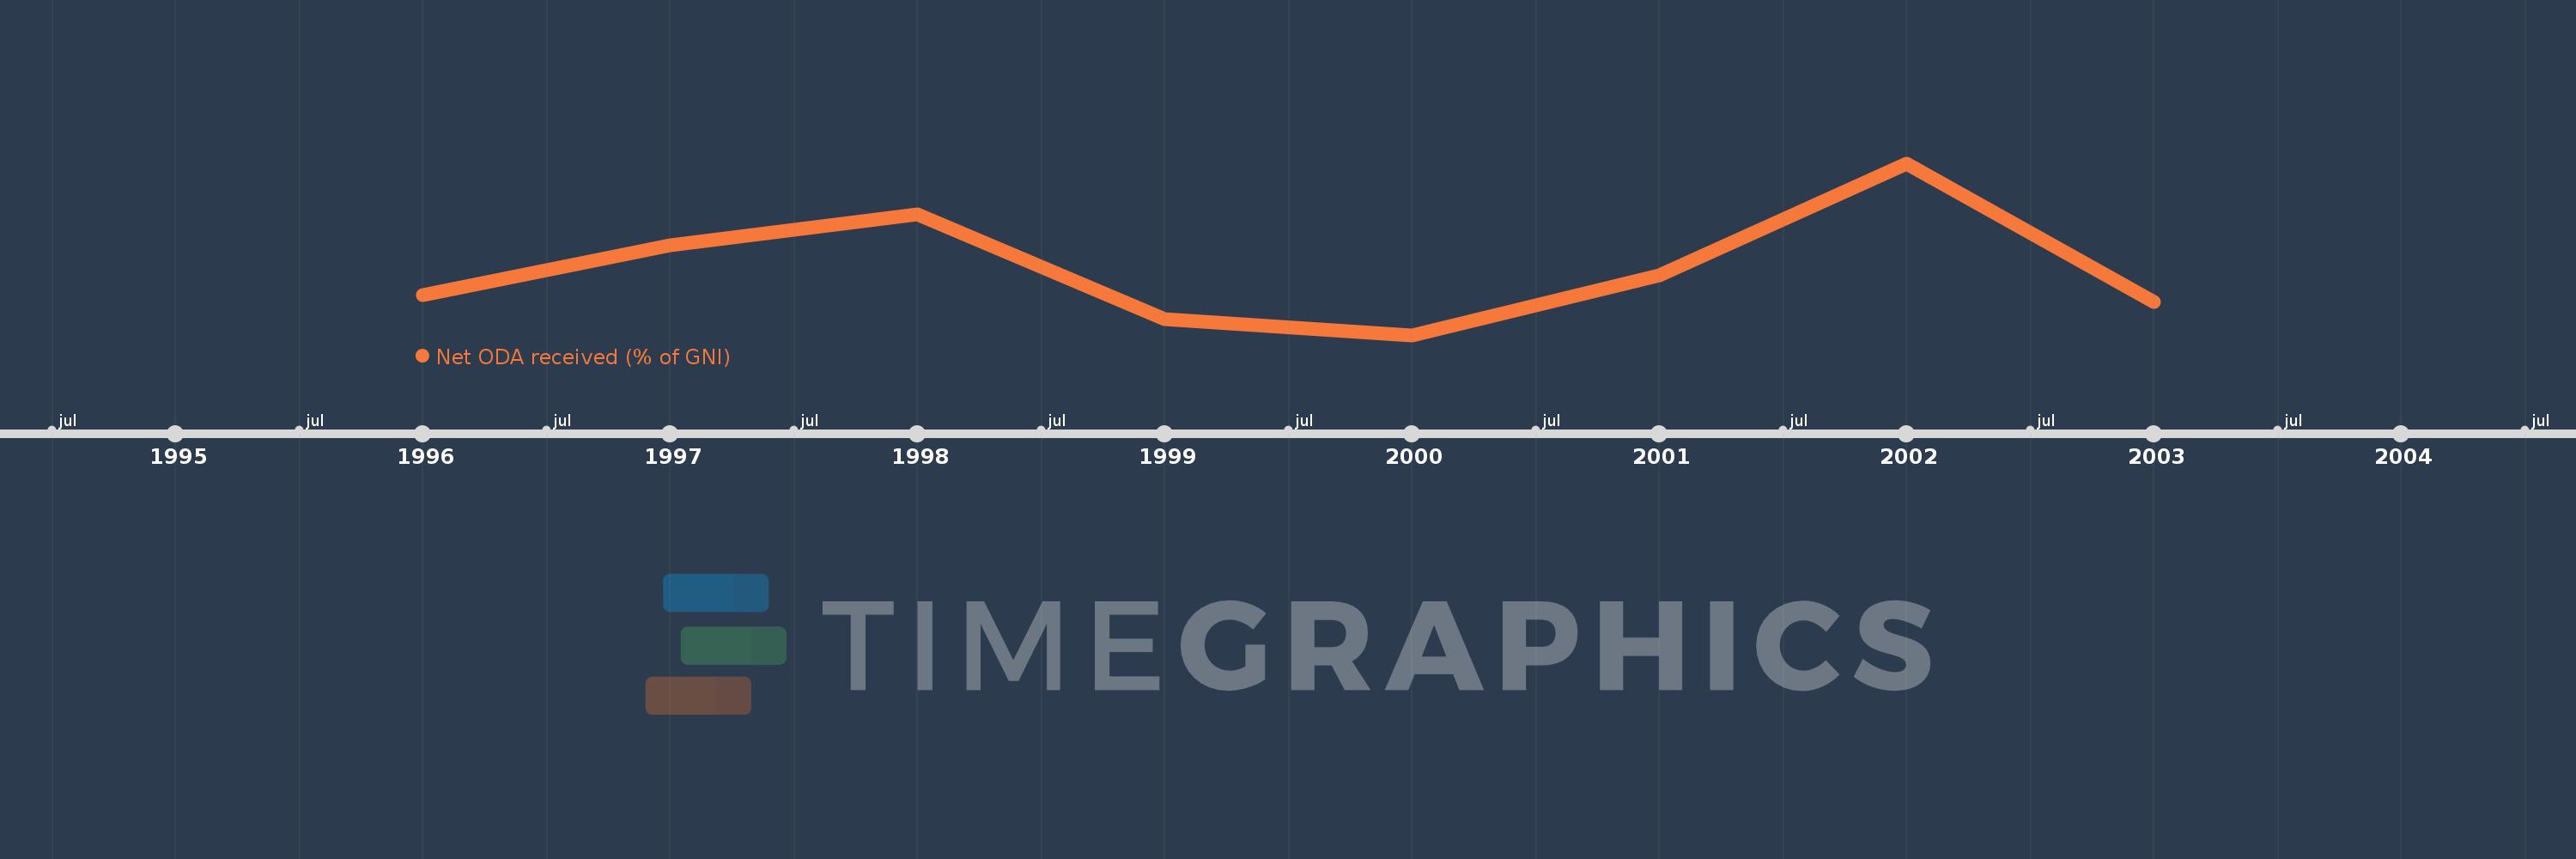
This timeline shows a graph from 1996 to 2003 of Slovenia. No data until 1995. Number of actual observations by date: 8.
Source name:
World Development Indicators
Source organization:
Development Assistance Committee of the Organisation for Economic Co-operation and Development, Geographical Distribution of Financial Flows to Developing Countries, Development Co-operation Report, and International Development Statistics database. Data are available online at: www.oecd.org/dac/stats/idsonline. World Bank GNI estimates are used for the denominator.
Categories, topics:
Aid Effectiveness, Economy & Growth, External Debt
Last updated:
apr 23, 2017
Indicators value changes by year
Meaning:
0.316
Minimum:
0.136
jan 1, 2000
Maximum:
0.6
jan 1, 2002
At the date of observation
Value
Absolute change
Change from the previous value
jan 1, 1996
0.244
+0.244
0.0%
jan 1, 1997
0.379
+0.135
55.25%
jan 1, 1998
0.463
+0.084
22.12%
jan 1, 1999
0.179
-0.284
-61.36%
jan 1, 2000
0.136
-0.043
-23.89%
jan 1, 2001
0.298
+0.162
118.93%
jan 1, 2002
0.6
+0.302
101.11%
jan 1, 2003
0.225
-0.375
-62.5%
Ranking of countries by current statistics by years