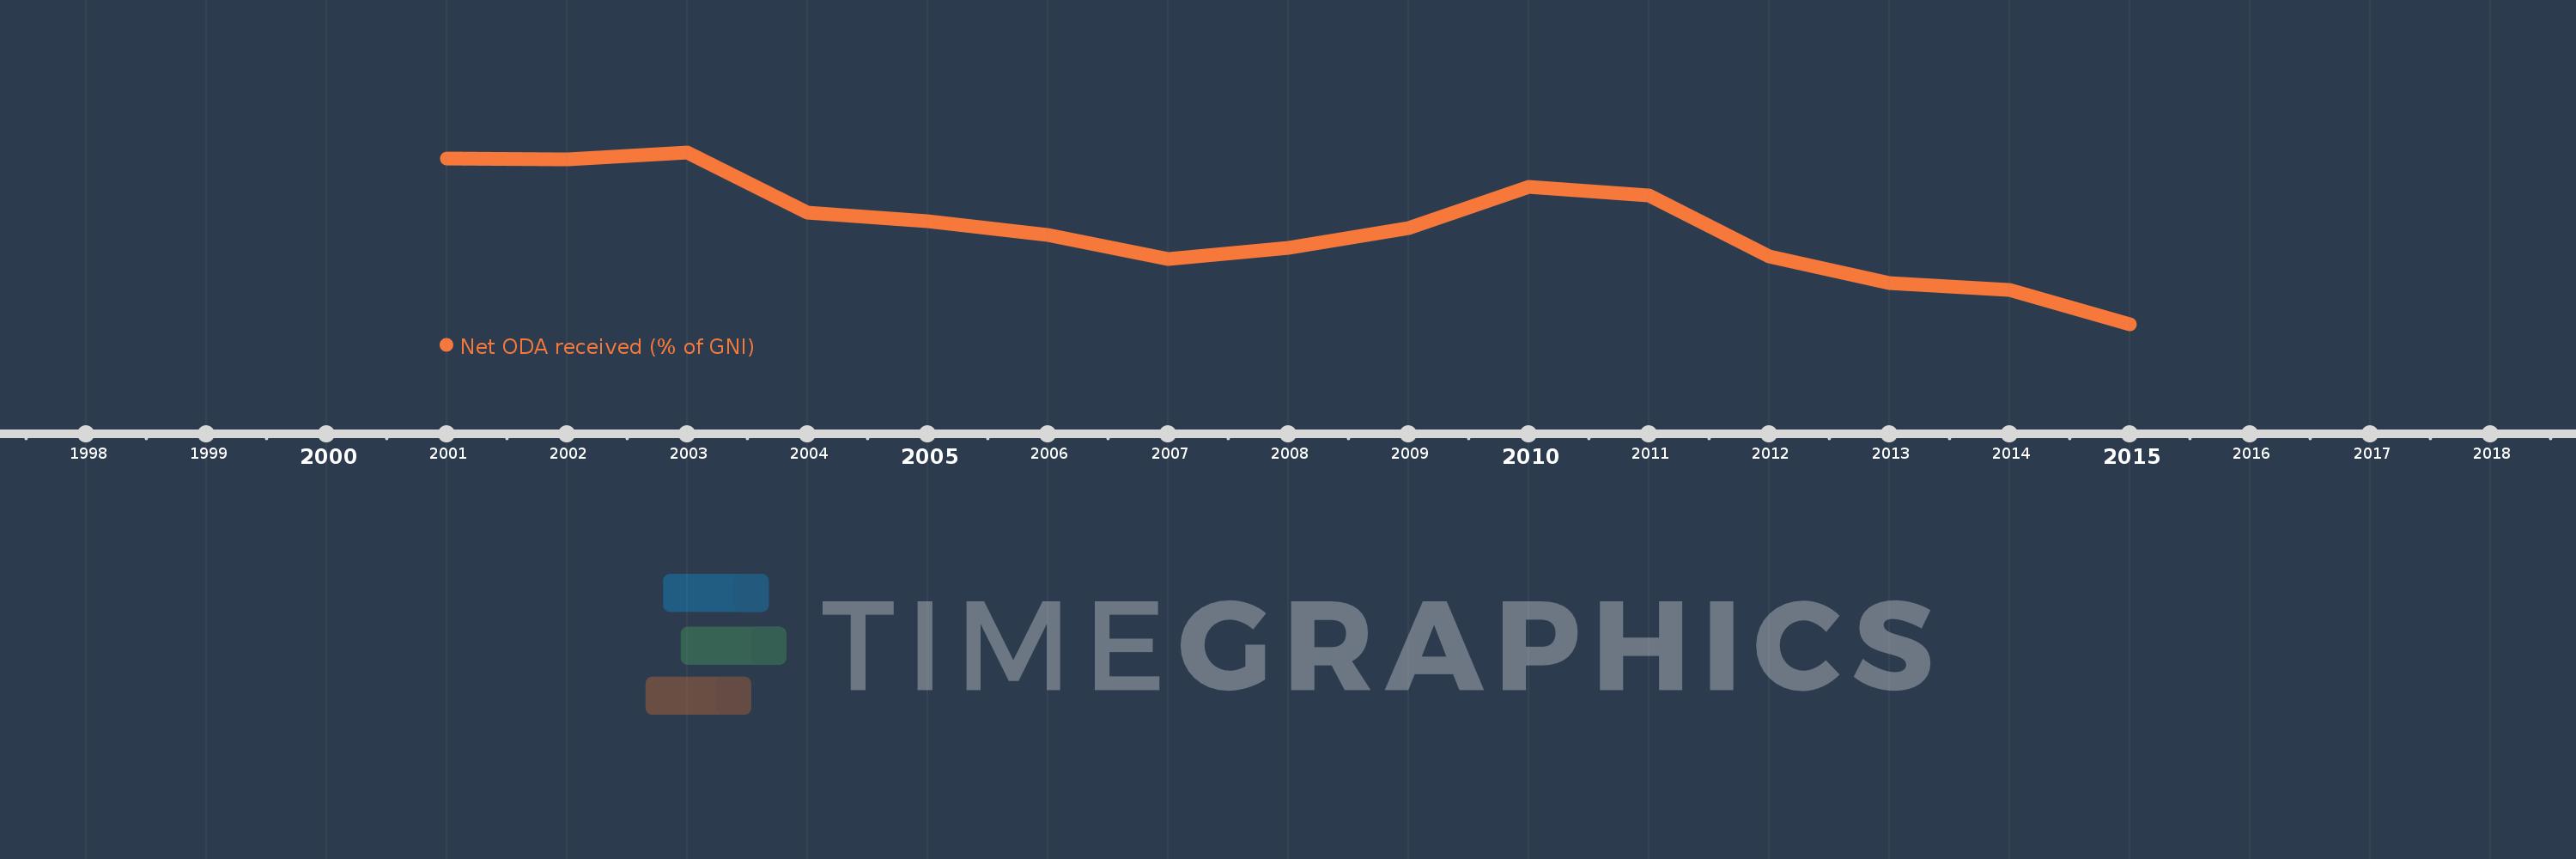
This timeline shows a graph from 2001 to 2015 of Small states. No data until 2000. Number of actual observations by date: 15.
Source name:
World Development Indicators
Source organization:
Development Assistance Committee of the Organisation for Economic Co-operation and Development, Geographical Distribution of Financial Flows to Developing Countries, Development Co-operation Report, and International Development Statistics database. Data are available online at: www.oecd.org/dac/stats/idsonline. World Bank GNI estimates are used for the denominator.
Categories, topics:
Aid Effectiveness, Economy & Growth, External Debt
Last updated:
apr 23, 2017
Indicators value changes by year
Meaning:
1.017
Minimum:
0.641
jan 1, 2015
Maximum:
1.309
jan 1, 2003
At the date of observation
Value
Absolute change
Change from the previous value
jan 1, 2001
1.284
+1.284
0.0%
jan 1, 2002
1.281
-0.004
-0.28%
jan 1, 2003
1.309
+0.028
2.2%
jan 1, 2004
1.075
-0.234
-17.86%
jan 1, 2005
1.042
-0.034
-3.13%
jan 1, 2006
0.988
-0.054
-5.19%
jan 1, 2007
0.895
-0.093
-9.39%
jan 1, 2008
0.937
+0.042
4.69%
jan 1, 2009
1.015
+0.078
8.35%
jan 1, 2010
1.176
+0.161
15.91%
jan 1, 2011
1.14
-0.036
-3.07%
jan 1, 2012
0.904
-0.236
-20.69%
jan 1, 2013
0.8
-0.105
-11.59%
jan 1, 2014
0.775
-0.025
-3.07%
jan 1, 2015
0.641
-0.134
-17.35%
Ranking of countries by current statistics by years