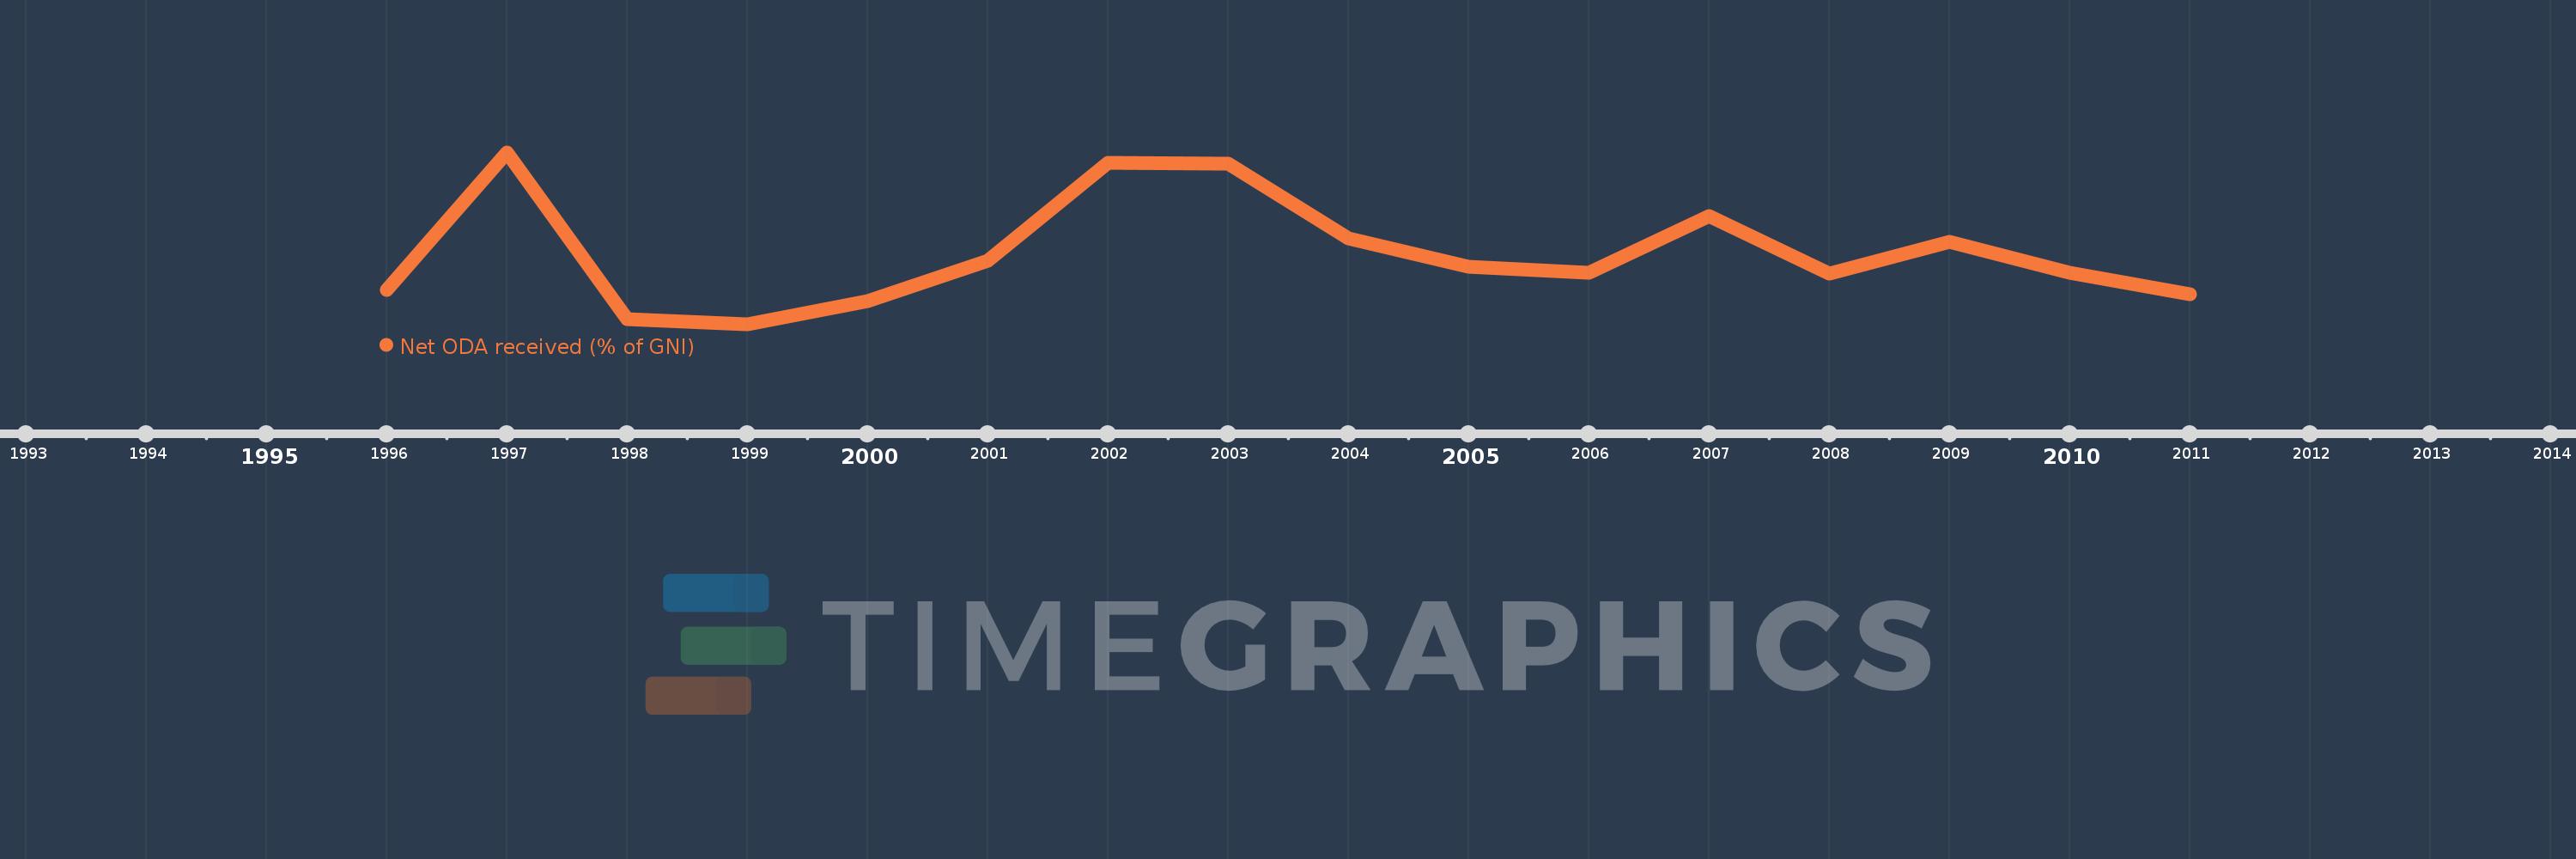
This timeline shows a graph from 1996 to 2011 of Croatia. No data until 1995. Number of actual observations by date: 16.
Source name:
World Development Indicators
Source organization:
Development Assistance Committee of the Organisation for Economic Co-operation and Development, Geographical Distribution of Financial Flows to Developing Countries, Development Co-operation Report, and International Development Statistics database. Data are available online at: www.oecd.org/dac/stats/idsonline. World Bank GNI estimates are used for the denominator.
Categories, topics:
Aid Effectiveness, Economy & Growth, External Debt
Last updated:
apr 23, 2017
Indicators value changes by year
Meaning:
0.325
Minimum:
0.156
jan 1, 1999
Maximum:
0.565
jan 1, 1997
At the date of observation
Value
Absolute change
Change from the previous value
jan 1, 1996
0.238
+0.238
0.0%
jan 1, 1997
0.565
+0.327
137.06%
jan 1, 1998
0.169
-0.395
-69.99%
jan 1, 1999
0.156
-0.014
-8.03%
jan 1, 2000
0.212
+0.056
35.8%
jan 1, 2001
0.307
+0.095
44.86%
jan 1, 2002
0.541
+0.235
76.57%
jan 1, 2003
0.539
-0.002
-0.37%
jan 1, 2004
0.36
-0.179
-33.27%
jan 1, 2005
0.292
-0.067
-18.73%
jan 1, 2006
0.278
-0.015
-5.08%
jan 1, 2007
0.414
+0.136
48.95%
jan 1, 2008
0.277
-0.137
-33.1%
jan 1, 2009
0.352
+0.076
27.37%
jan 1, 2010
0.278
-0.074
-21.06%
jan 1, 2011
0.227
-0.051
-18.48%
Ranking of countries by current statistics by years