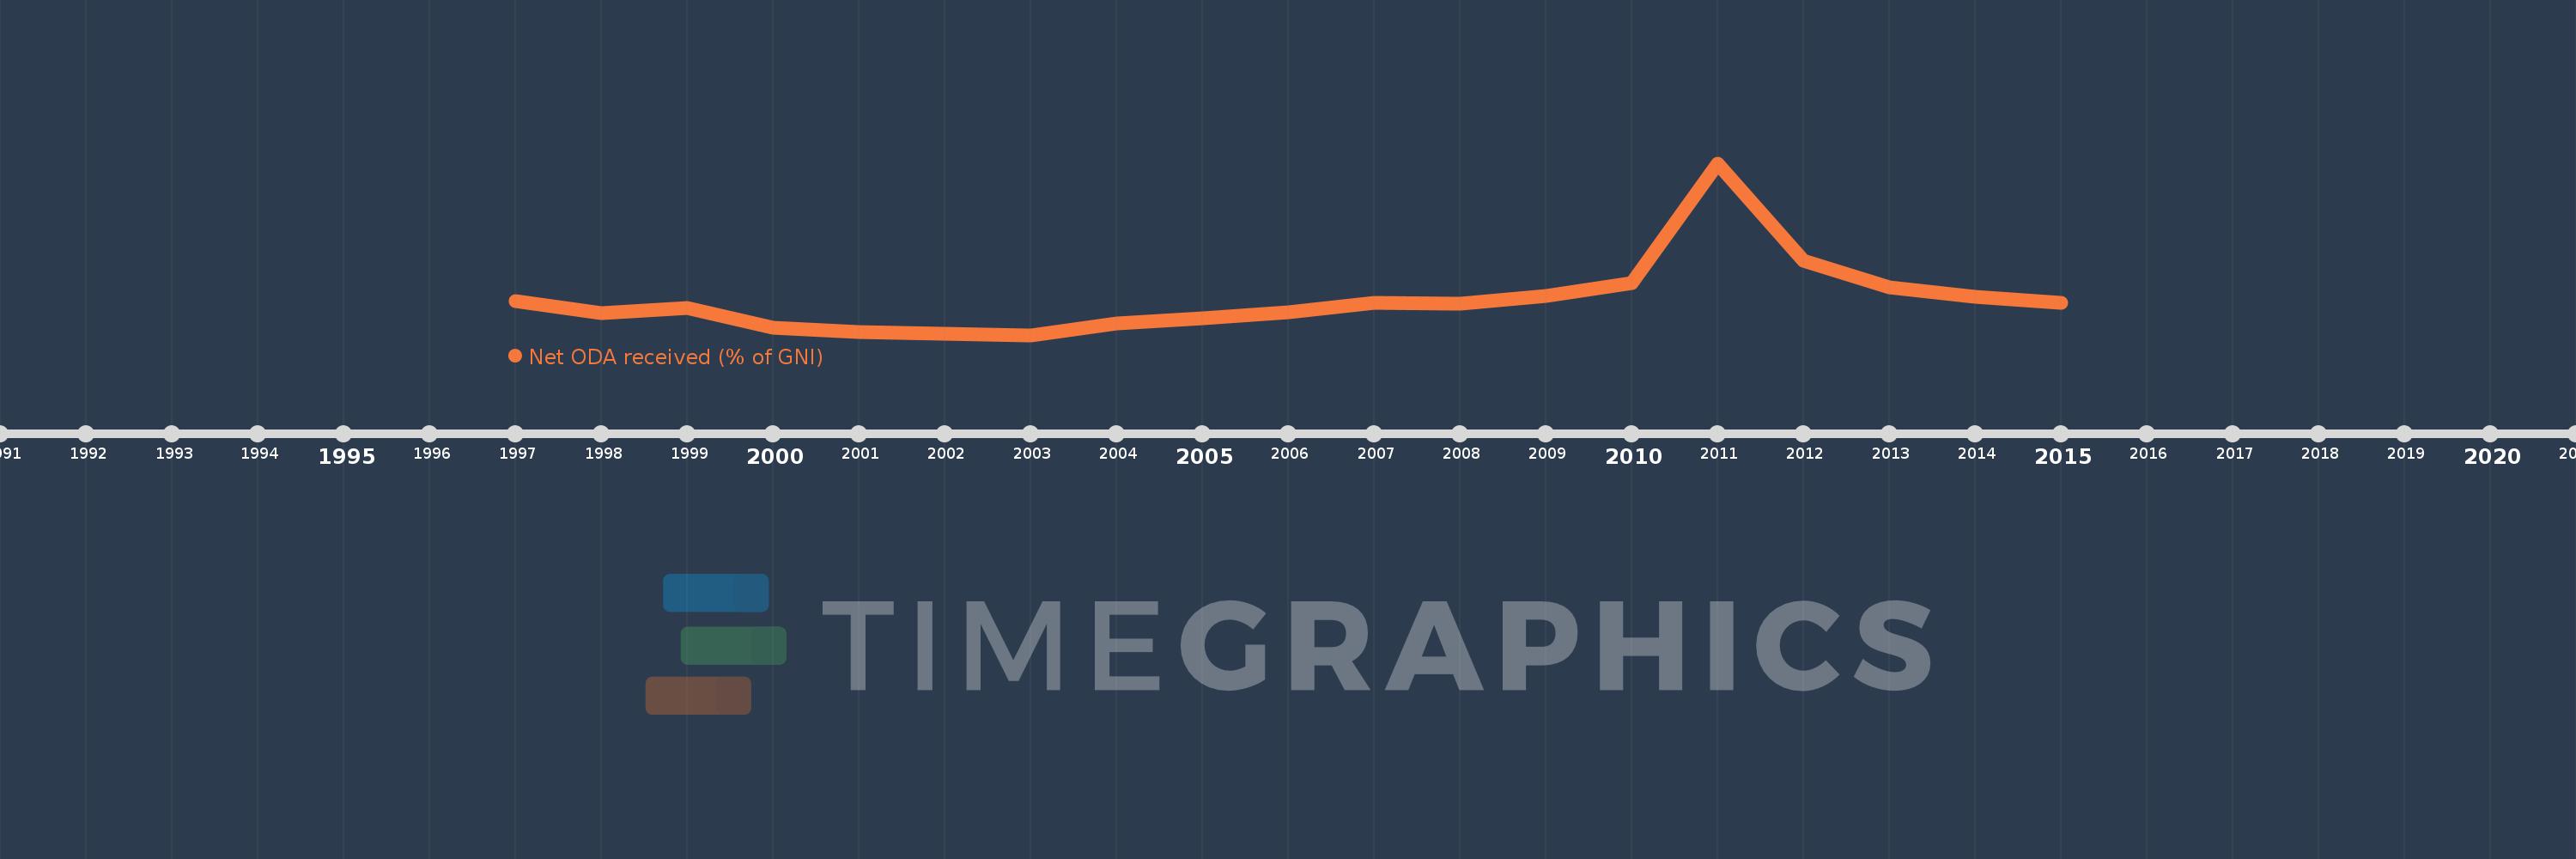
This timeline shows a graph from 1997 to 2015 of Haiti. No data until 1996. Number of actual observations by date: 19.
Source name:
World Development Indicators
Source organization:
Development Assistance Committee of the Organisation for Economic Co-operation and Development, Geographical Distribution of Financial Flows to Developing Countries, Development Co-operation Report, and International Development Statistics database. Data are available online at: www.oecd.org/dac/stats/idsonline. World Bank GNI estimates are used for the denominator.
Categories, topics:
Aid Effectiveness, Economy & Growth, External Debt
Last updated:
apr 23, 2017
Indicators value changes by year
Meaning:
12.874
Minimum:
4.503
jan 1, 2003
Maximum:
45.69
jan 1, 2011
At the date of observation
Value
Absolute change
Change from the previous value
jan 1, 1997
12.577
+12.577
0.0%
jan 1, 1998
9.701
-2.876
-22.87%
jan 1, 1999
10.905
+1.204
12.41%
jan 1, 2000
6.32
-4.585
-42.04%
jan 1, 2001
5.239
-1.081
-17.11%
jan 1, 2002
4.736
-0.503
-9.61%
jan 1, 2003
4.503
-0.232
-4.9%
jan 1, 2004
7.225
+2.722
60.44%
jan 1, 2005
8.468
+1.243
17.2%
jan 1, 2006
9.958
+1.49
17.59%
jan 1, 2007
12.224
+2.266
22.75%
jan 1, 2008
11.917
-0.307
-2.51%
jan 1, 2009
13.916
+1.999
16.78%
jan 1, 2010
16.971
+3.055
21.95%
jan 1, 2011
45.69
+28.719
169.22%
jan 1, 2012
22.368
-23.321
-51.04%
jan 1, 2013
16.006
-6.362
-28.44%
jan 1, 2014
13.572
-2.434
-15.21%
jan 1, 2015
12.307
-1.265
-9.32%
Ranking of countries by current statistics by years