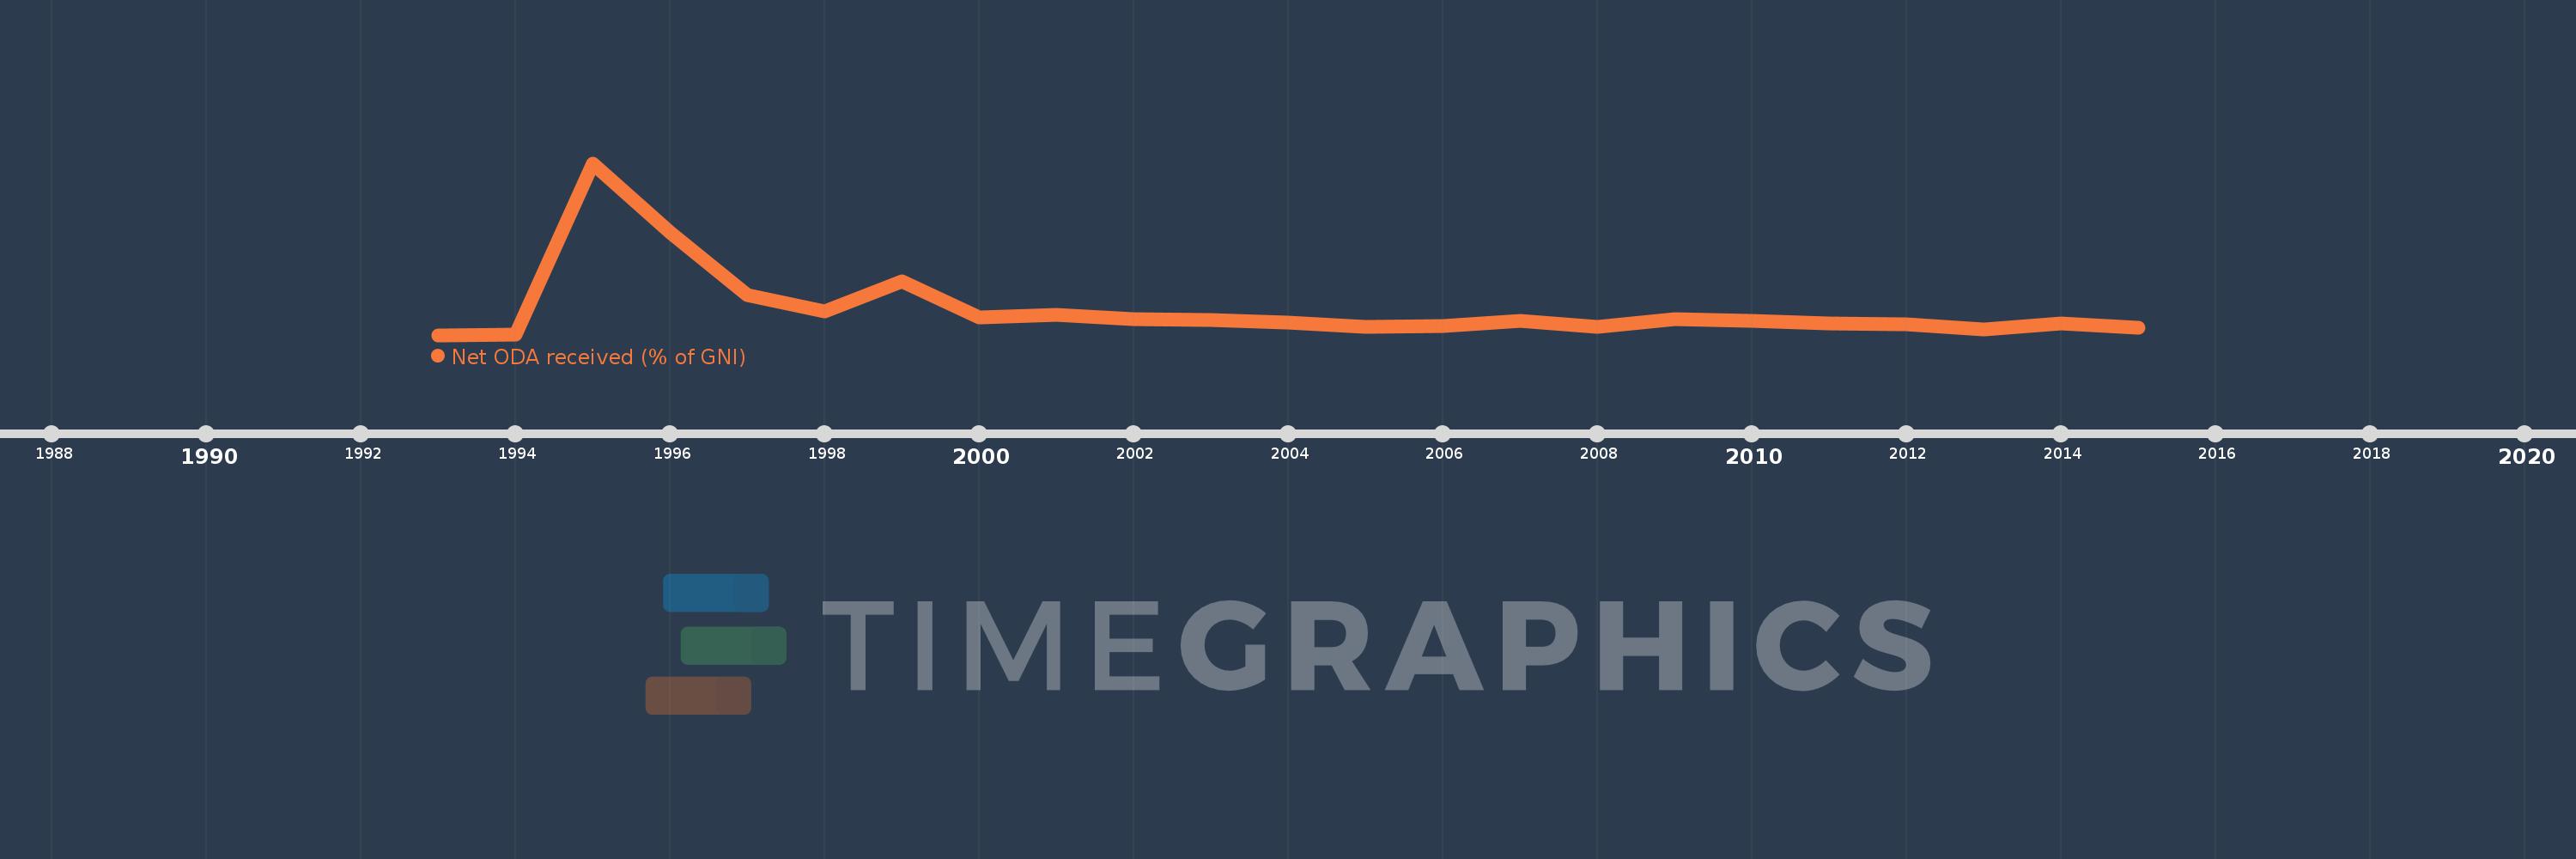
This timeline shows a graph from 1993 to 2015 of Palau. No data until 1992. Number of actual observations by date: 23.
Source name:
World Development Indicators
Source organization:
Development Assistance Committee of the Organisation for Economic Co-operation and Development, Geographical Distribution of Financial Flows to Developing Countries, Development Co-operation Report, and International Development Statistics database. Data are available online at: www.oecd.org/dac/stats/idsonline. World Bank GNI estimates are used for the denominator.
Categories, topics:
Aid Effectiveness, Economy & Growth, External Debt
Last updated:
apr 23, 2017
Indicators value changes by year
Meaning:
36.076
Minimum:
0.012
jan 1, 1993
Maximum:
242.286
jan 1, 1995
At the date of observation
Value
Absolute change
Change from the previous value
jan 1, 1993
0.012
+0.012
0.0%
jan 1, 1994
0.013
+0.001
4.52%
jan 1, 1995
242.286
+242.274
1.92 mln%
jan 1, 1996
145.122
-97.164
-40.1%
jan 1, 1997
56.272
-88.85
-61.22%
jan 1, 1998
32.78
-23.493
-41.75%
jan 1, 1999
75.788
+43.009
131.21%
jan 1, 2000
24.382
-51.406
-67.83%
jan 1, 2001
28.03
+3.648
14.96%
jan 1, 2002
23.009
-5.021
-17.91%
jan 1, 2003
20.79
-2.219
-9.64%
jan 1, 2004
17.131
-3.659
-17.6%
jan 1, 2005
11.679
-5.452
-31.83%
jan 1, 2006
12.875
+1.196
10.24%
jan 1, 2007
20.162
+7.287
56.6%
jan 1, 2008
12.043
-8.119
-40.27%
jan 1, 2009
23.012
+10.969
91.08%
jan 1, 2010
19.76
-3.252
-14.13%
jan 1, 2011
16.08
-3.679
-18.62%
jan 1, 2012
14.848
-1.232
-7.66%
jan 1, 2013
7.578
-7.27
-48.96%
jan 1, 2014
16.311
+8.733
115.25%
jan 1, 2015
9.783
-6.528
-40.02%
Ranking of countries by current statistics by years