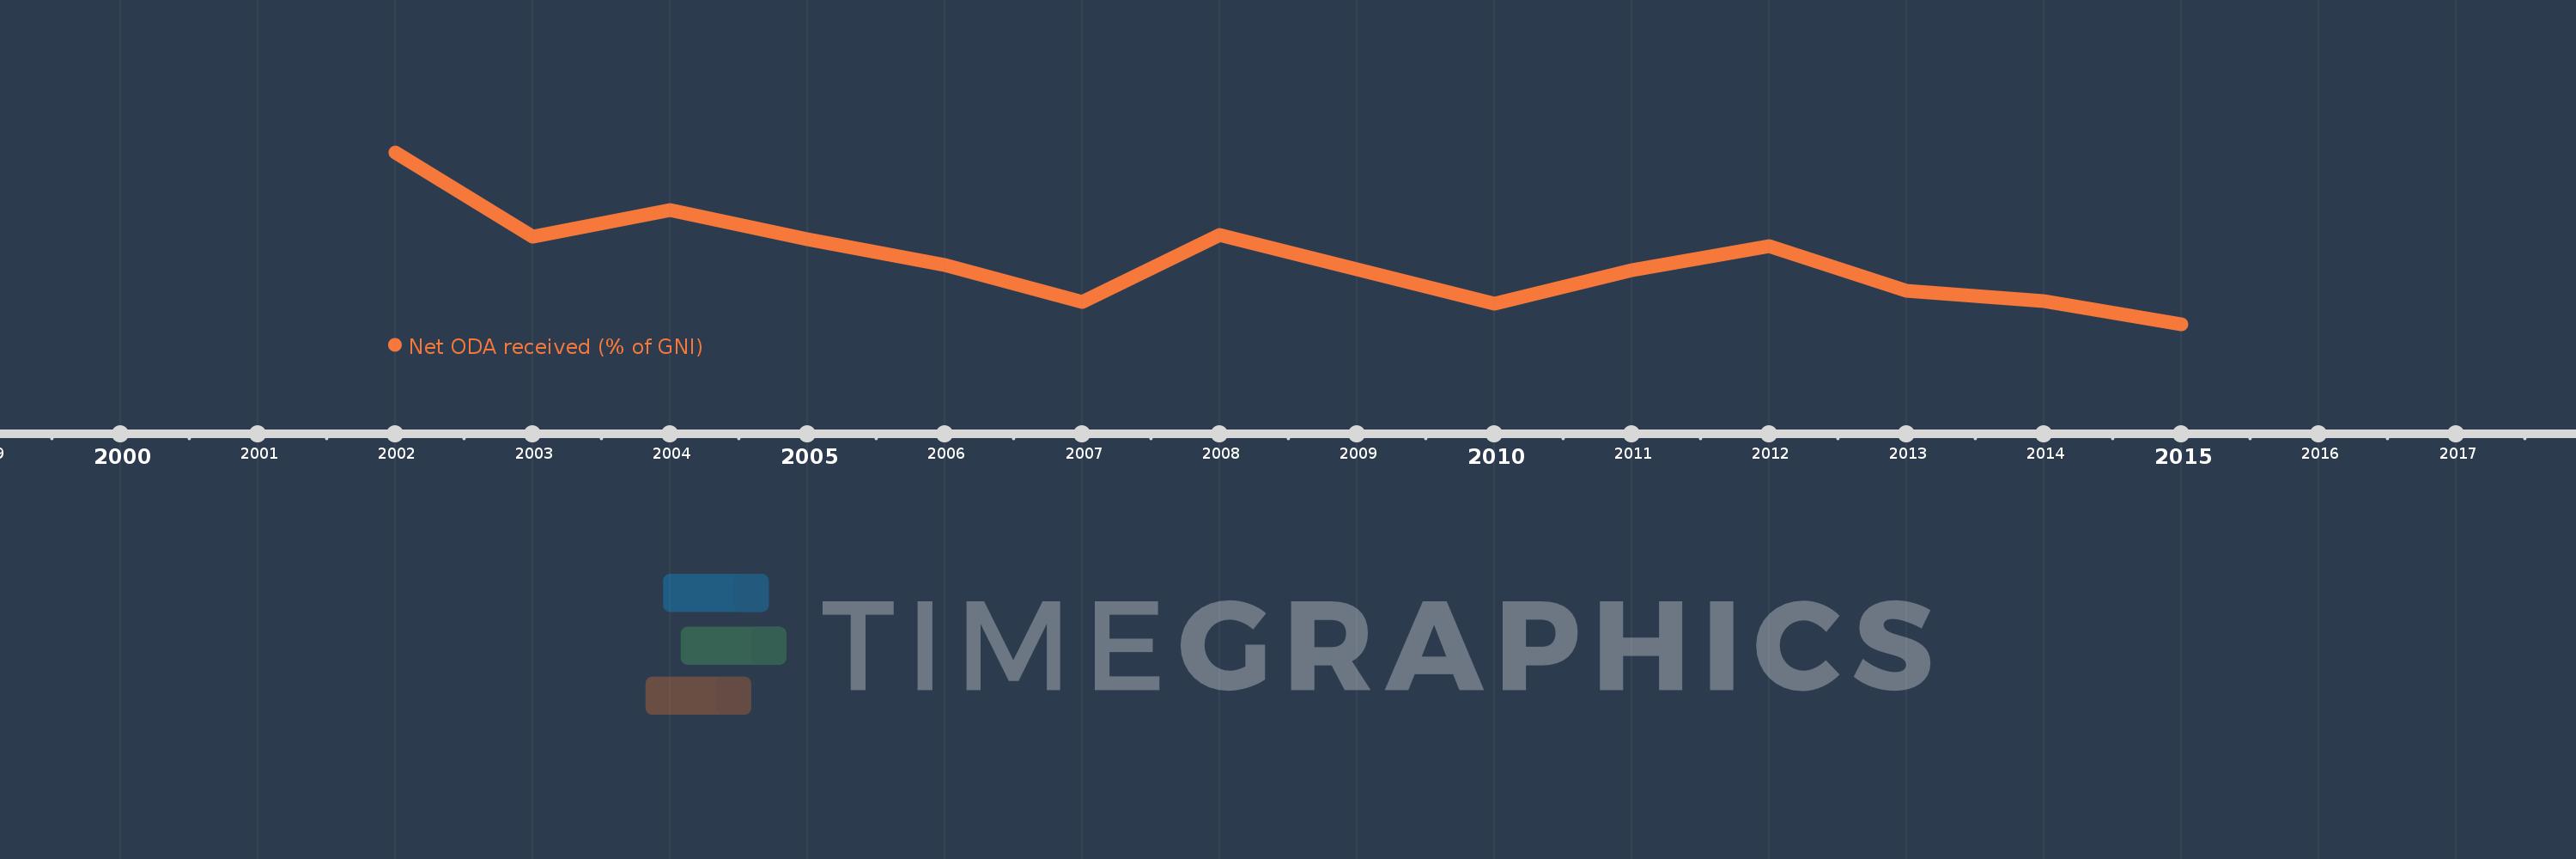
This timeline shows a graph from 2002 to 2015 of Sao Tome and Principe. No data until 2001. Number of actual observations by date: 14.
Source name:
World Development Indicators
Source organization:
Development Assistance Committee of the Organisation for Economic Co-operation and Development, Geographical Distribution of Financial Flows to Developing Countries, Development Co-operation Report, and International Development Statistics database. Data are available online at: www.oecd.org/dac/stats/idsonline. World Bank GNI estimates are used for the denominator.
Categories, topics:
Aid Effectiveness, Economy & Growth, External Debt
Last updated:
apr 23, 2017
Indicators value changes by year
Meaning:
27.454
Minimum:
10.863
jan 1, 2015
Maximum:
55.529
jan 1, 2002
At the date of observation
Value
Absolute change
Change from the previous value
jan 1, 2002
55.529
+55.529
0.0%
jan 1, 2003
33.579
-21.949
-39.53%
jan 1, 2004
40.479
+6.9
20.55%
jan 1, 2005
32.885
-7.594
-18.76%
jan 1, 2006
26.317
-6.568
-19.97%
jan 1, 2007
16.68
-9.637
-36.62%
jan 1, 2008
33.992
+17.312
103.79%
jan 1, 2009
25.182
-8.809
-25.92%
jan 1, 2010
16.269
-8.914
-35.4%
jan 1, 2011
25.015
+8.746
53.76%
jan 1, 2012
31.097
+6.082
24.31%
jan 1, 2013
19.49
-11.607
-37.33%
jan 1, 2014
16.982
-2.508
-12.87%
jan 1, 2015
10.863
-6.119
-36.03%
Ranking of countries by current statistics by years