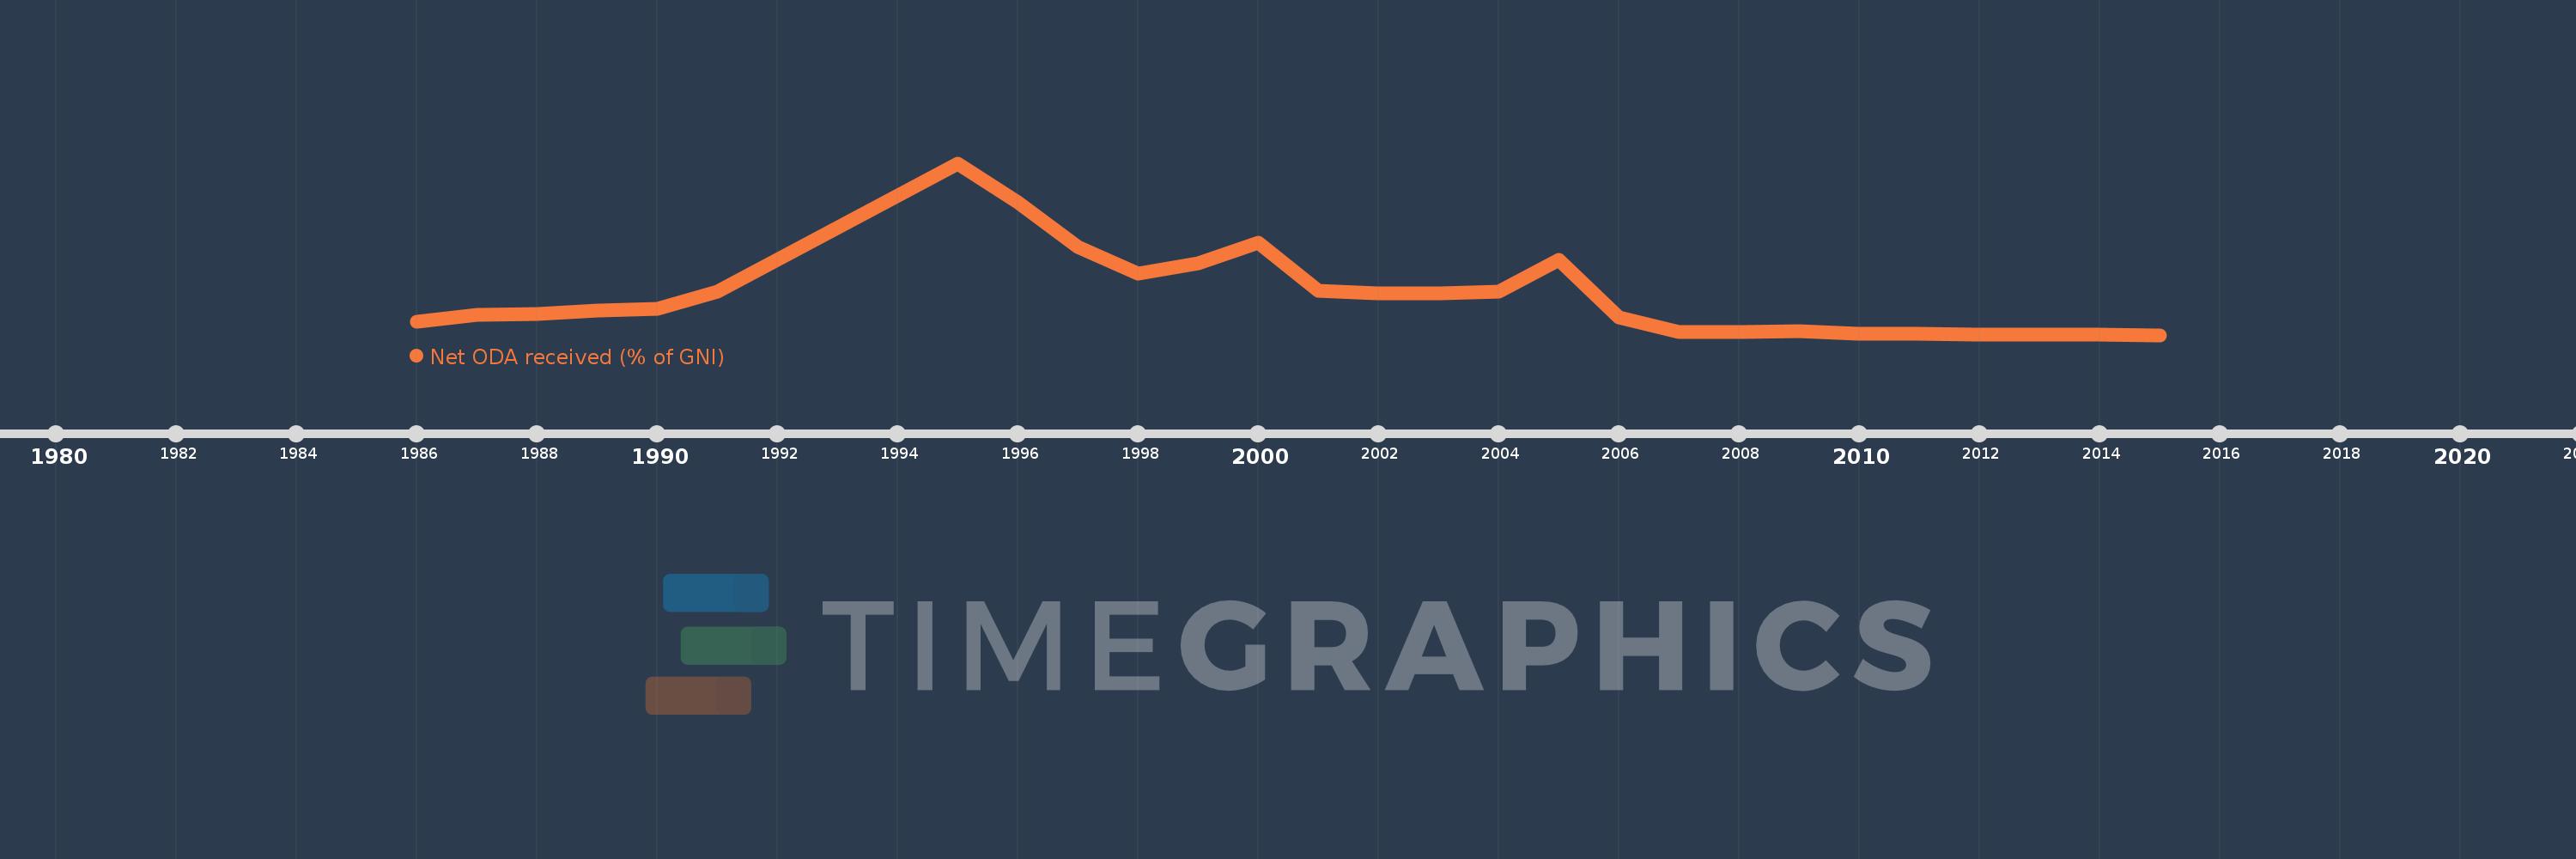
This timeline shows a graph from 1986 to 2015 of Angola. No data until 1985. Number of actual observations by date: 27.
Source name:
World Development Indicators
Source organization:
Development Assistance Committee of the Organisation for Economic Co-operation and Development, Geographical Distribution of Financial Flows to Developing Countries, Development Co-operation Report, and International Development Statistics database. Data are available online at: www.oecd.org/dac/stats/idsonline. World Bank GNI estimates are used for the denominator.
Categories, topics:
Aid Effectiveness, Economy & Growth, External Debt
Last updated:
apr 23, 2017
Indicators value changes by year
Meaning:
3.552
Minimum:
0.203
jan 1, 2015
Maximum:
15.058
jan 1, 1995
At the date of observation
Value
Absolute change
Change from the previous value
jan 1, 1986
1.353
+1.353
0.0%
jan 1, 1987
1.947
+0.594
43.94%
jan 1, 1988
2.01
+0.062
3.21%
jan 1, 1989
2.348
+0.338
16.81%
jan 1, 1990
2.498
+0.15
6.39%
jan 1, 1991
3.973
+1.476
59.09%
jan 1, 1995
15.058
+11.085
278.98%
jan 1, 1996
11.663
-3.394
-22.54%
jan 1, 1997
7.808
-3.856
-33.06%
jan 1, 1998
5.549
-2.259
-28.93%
jan 1, 1999
6.41
+0.861
15.52%
jan 1, 2000
8.217
+1.807
28.19%
jan 1, 2001
4.057
-4.16
-50.63%
jan 1, 2002
3.834
-0.224
-5.51%
jan 1, 2003
3.811
-0.022
-0.58%
jan 1, 2004
3.962
+0.15
3.94%
jan 1, 2005
6.67
+2.709
68.37%
jan 1, 2006
1.713
-4.958
-74.32%
jan 1, 2007
0.459
-1.254
-73.19%
jan 1, 2008
0.469
+0.009
2.06%
jan 1, 2009
0.523
+0.055
11.7%
jan 1, 2010
0.348
-0.176
-33.59%
jan 1, 2011
0.319
-0.029
-8.37%
jan 1, 2012
0.204
-0.114
-35.91%
jan 1, 2013
0.235
+0.031
15.01%
jan 1, 2014
0.251
+0.017
7.08%
jan 1, 2015
0.203
-0.049
-19.36%
Ranking of countries by current statistics by years