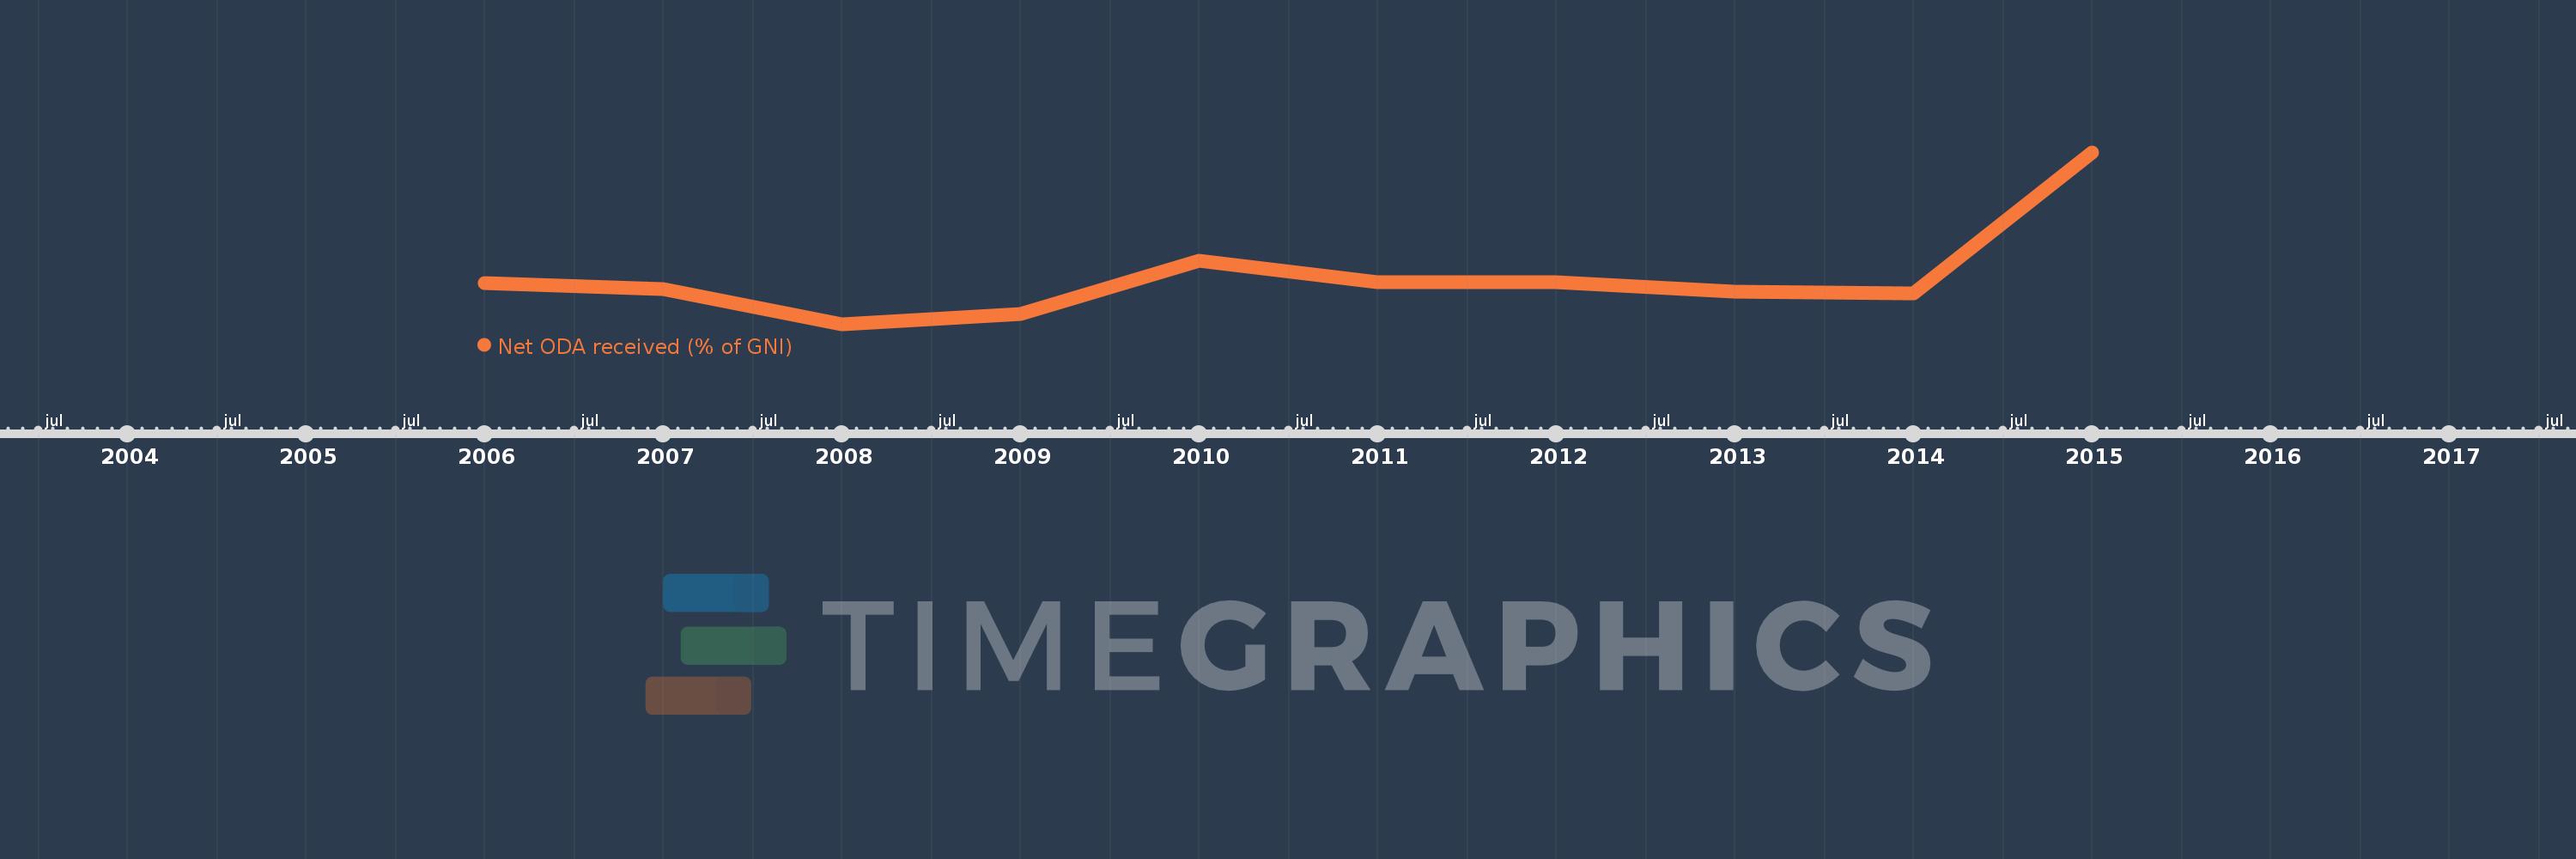
This timeline shows a graph from 2006 to 2015 of Ukraine. No data until 2005. Number of actual observations by date: 10.
Source name:
World Development Indicators
Source organization:
Development Assistance Committee of the Organisation for Economic Co-operation and Development, Geographical Distribution of Financial Flows to Developing Countries, Development Co-operation Report, and International Development Statistics database. Data are available online at: www.oecd.org/dac/stats/idsonline. World Bank GNI estimates are used for the denominator.
Categories, topics:
Aid Effectiveness, Economy & Growth, External Debt
Last updated:
apr 23, 2017
Indicators value changes by year
Meaning:
0.508
Minimum:
0.299
jan 1, 2008
Maximum:
1.064
jan 1, 2015
At the date of observation
Value
Absolute change
Change from the previous value
jan 1, 2006
0.483
+0.483
0.0%
jan 1, 2007
0.456
-0.027
-5.68%
jan 1, 2008
0.299
-0.157
-34.45%
jan 1, 2009
0.346
+0.047
15.85%
jan 1, 2010
0.58
+0.234
67.61%
jan 1, 2011
0.486
-0.094
-16.25%
jan 1, 2012
0.486
+0.0
0.06%
jan 1, 2013
0.444
-0.042
-8.68%
jan 1, 2014
0.435
-0.009
-2.12%
jan 1, 2015
1.064
+0.629
144.7%
Ranking of countries by current statistics by years