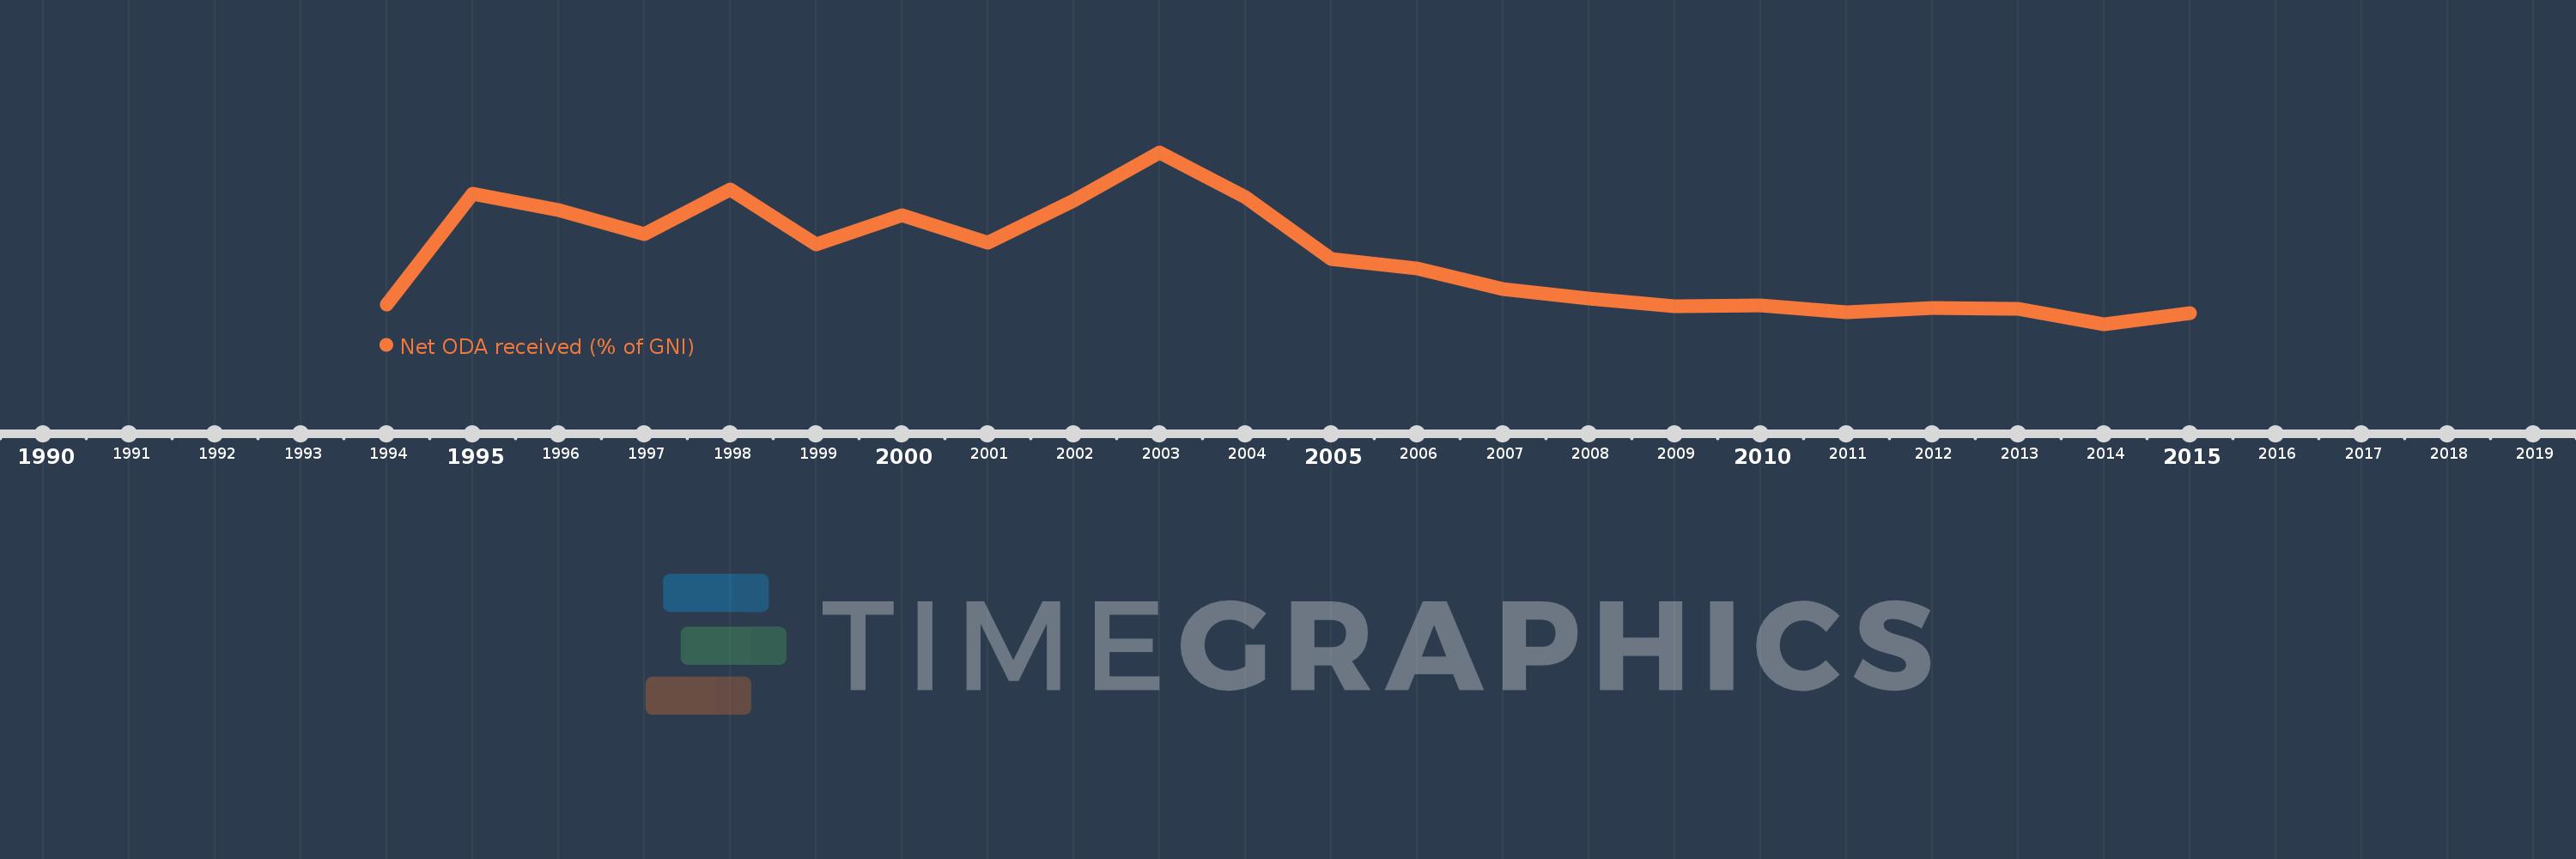
This timeline shows a graph from 1994 to 2015 of Azerbaijan. No data until 1993. Number of actual observations by date: 22.
Source name:
World Development Indicators
Source organization:
Development Assistance Committee of the Organisation for Economic Co-operation and Development, Geographical Distribution of Financial Flows to Developing Countries, Development Co-operation Report, and International Development Statistics database. Data are available online at: www.oecd.org/dac/stats/idsonline. World Bank GNI estimates are used for the denominator.
Categories, topics:
Aid Effectiveness, Economy & Growth, External Debt
Last updated:
apr 23, 2017
Indicators value changes by year
Meaning:
2.237
Minimum:
-0.106
jan 1, 2014
Maximum:
5.97
jan 1, 2003
At the date of observation
Value
Absolute change
Change from the previous value
jan 1, 1994
0.601
+0.601
0.0%
jan 1, 1995
4.501
+3.9
648.87%
jan 1, 1996
3.934
-0.567
-12.61%
jan 1, 1997
3.094
-0.84
-21.35%
jan 1, 1998
4.656
+1.562
50.49%
jan 1, 1999
2.713
-1.943
-41.74%
jan 1, 2000
3.735
+1.022
37.69%
jan 1, 2001
2.789
-0.945
-25.31%
jan 1, 2002
4.277
+1.488
53.34%
jan 1, 2003
5.97
+1.692
39.57%
jan 1, 2004
4.4
-1.57
-26.29%
jan 1, 2005
2.203
-2.198
-49.95%
jan 1, 2006
1.867
-0.336
-15.25%
jan 1, 2007
1.128
-0.739
-39.59%
jan 1, 2008
0.805
-0.323
-28.6%
jan 1, 2009
0.54
-0.266
-32.99%
jan 1, 2010
0.568
+0.029
5.37%
jan 1, 2011
0.324
-0.245
-43.02%
jan 1, 2012
0.469
+0.145
44.82%
jan 1, 2013
0.45
-0.019
-3.98%
jan 1, 2014
-0.106
-0.556
-123.46%
jan 1, 2015
0.296
+0.402
-380.45%
Ranking of countries by current statistics by years