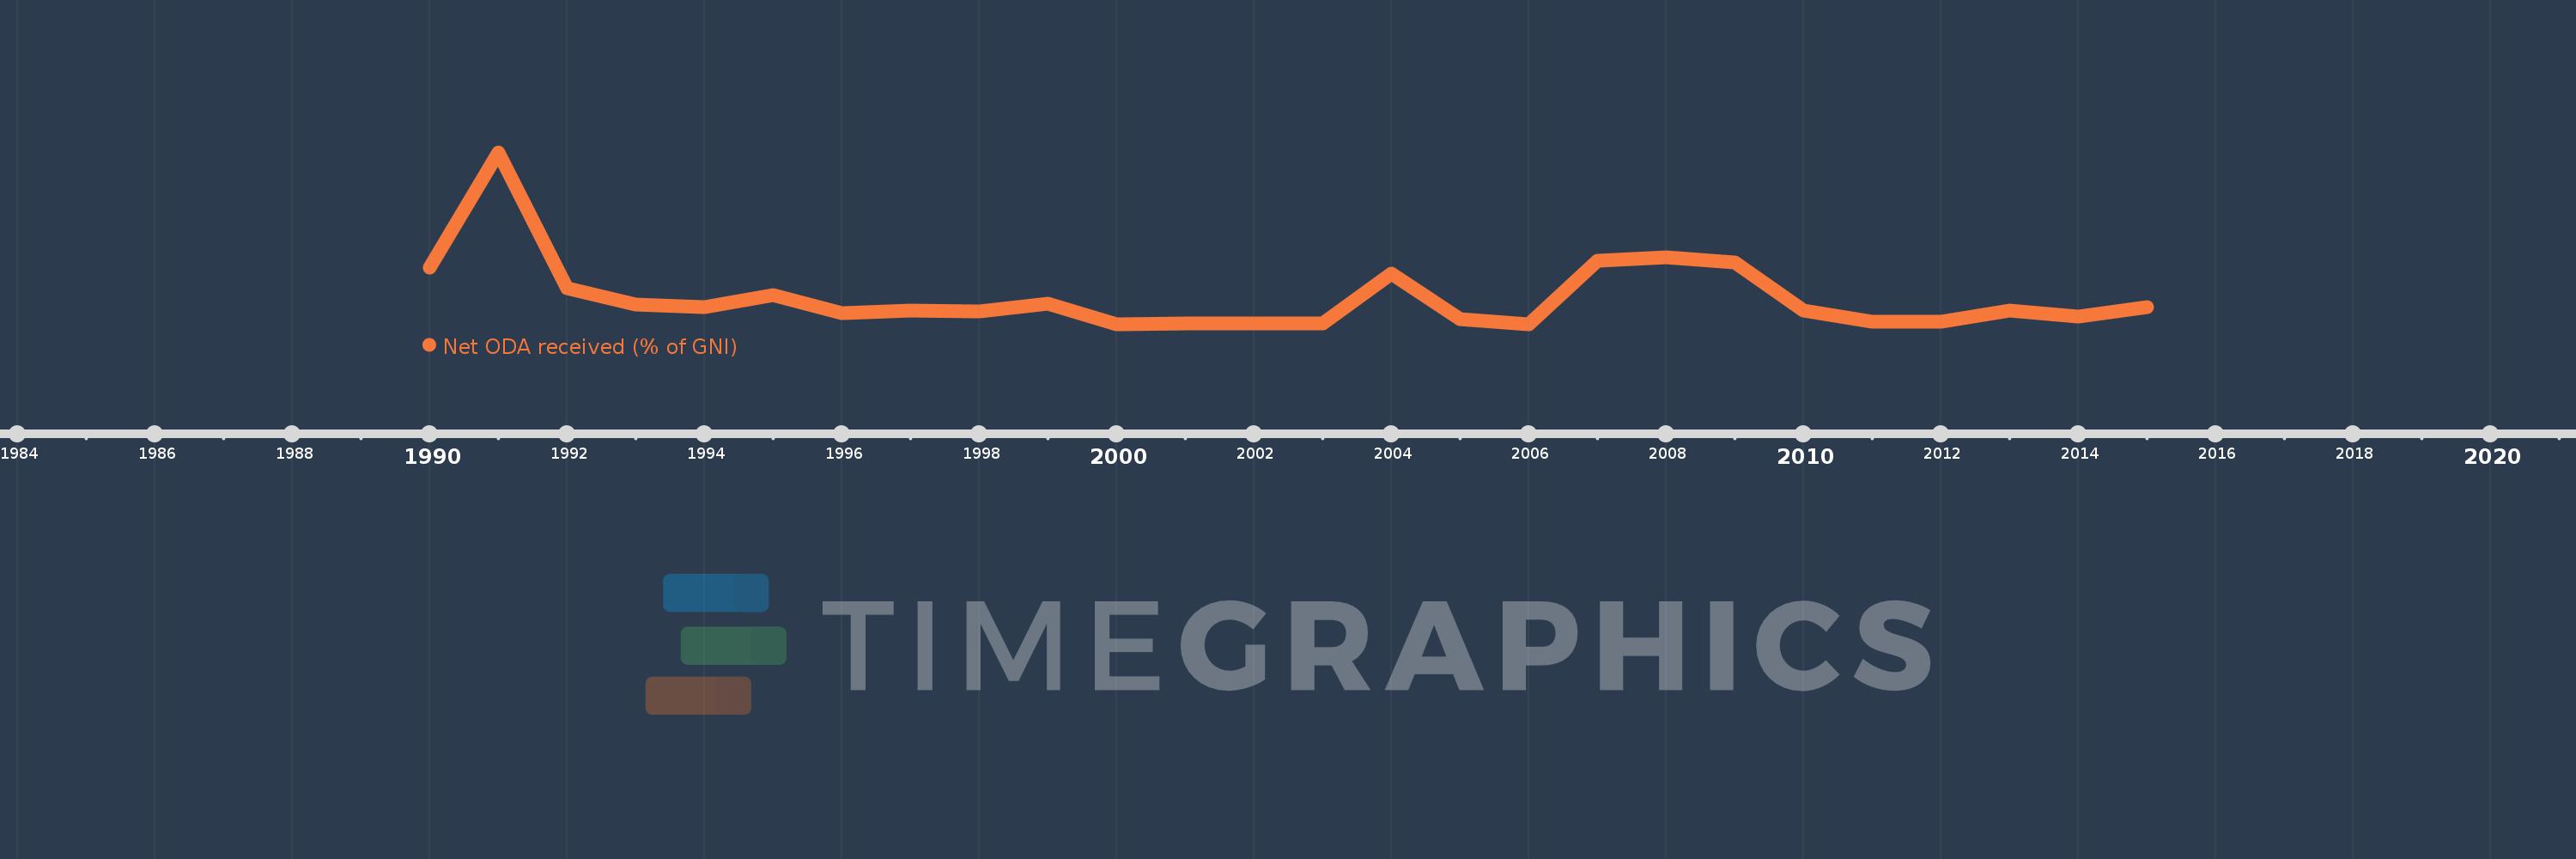
This timeline shows a graph from 1990 to 2015 of Lebanon. No data until 1989. Number of actual observations by date: 26.
Source name:
World Development Indicators
Source organization:
Development Assistance Committee of the Organisation for Economic Co-operation and Development, Geographical Distribution of Financial Flows to Developing Countries, Development Co-operation Report, and International Development Statistics database. Data are available online at: www.oecd.org/dac/stats/idsonline. World Bank GNI estimates are used for the denominator.
Categories, topics:
Aid Effectiveness, Economy & Growth, External Debt
Last updated:
apr 23, 2017
Indicators value changes by year
Meaning:
2.208
Minimum:
1.092
jan 1, 2006
Maximum:
8.255
jan 1, 1991
At the date of observation
Value
Absolute change
Change from the previous value
jan 1, 1990
3.457
+3.457
0.0%
jan 1, 1991
8.255
+4.798
138.79%
jan 1, 1992
2.596
-5.659
-68.56%
jan 1, 1993
1.903
-0.692
-26.67%
jan 1, 1994
1.805
-0.098
-5.15%
jan 1, 1995
2.297
+0.492
27.25%
jan 1, 1996
1.567
-0.731
-31.81%
jan 1, 1997
1.665
+0.099
6.3%
jan 1, 1998
1.622
-0.044
-2.62%
jan 1, 1999
1.956
+0.334
20.6%
jan 1, 2000
1.102
-0.854
-43.65%
jan 1, 2001
1.138
+0.036
3.22%
jan 1, 2002
1.129
-0.009
-0.76%
jan 1, 2003
1.112
-0.017
-1.53%
jan 1, 2004
3.21
+2.099
188.78%
jan 1, 2005
1.32
-1.891
-58.89%
jan 1, 2006
1.092
-0.227
-17.23%
jan 1, 2007
3.726
+2.634
241.15%
jan 1, 2008
3.867
+0.14
3.77%
jan 1, 2009
3.656
-0.211
-5.46%
jan 1, 2010
1.662
-1.993
-54.53%
jan 1, 2011
1.194
-0.468
-28.18%
jan 1, 2012
1.194
0.0
-0.01%
jan 1, 2013
1.654
+0.461
38.58%
jan 1, 2014
1.409
-0.245
-14.82%
jan 1, 2015
1.816
+0.407
28.89%
Ranking of countries by current statistics by years