29
/
en
AIzaSyAYiBZKx7MnpbEhh9jyipgxe19OcubqV5w
April 1, 2024
99087
Cambodia
KHM
true
2
1
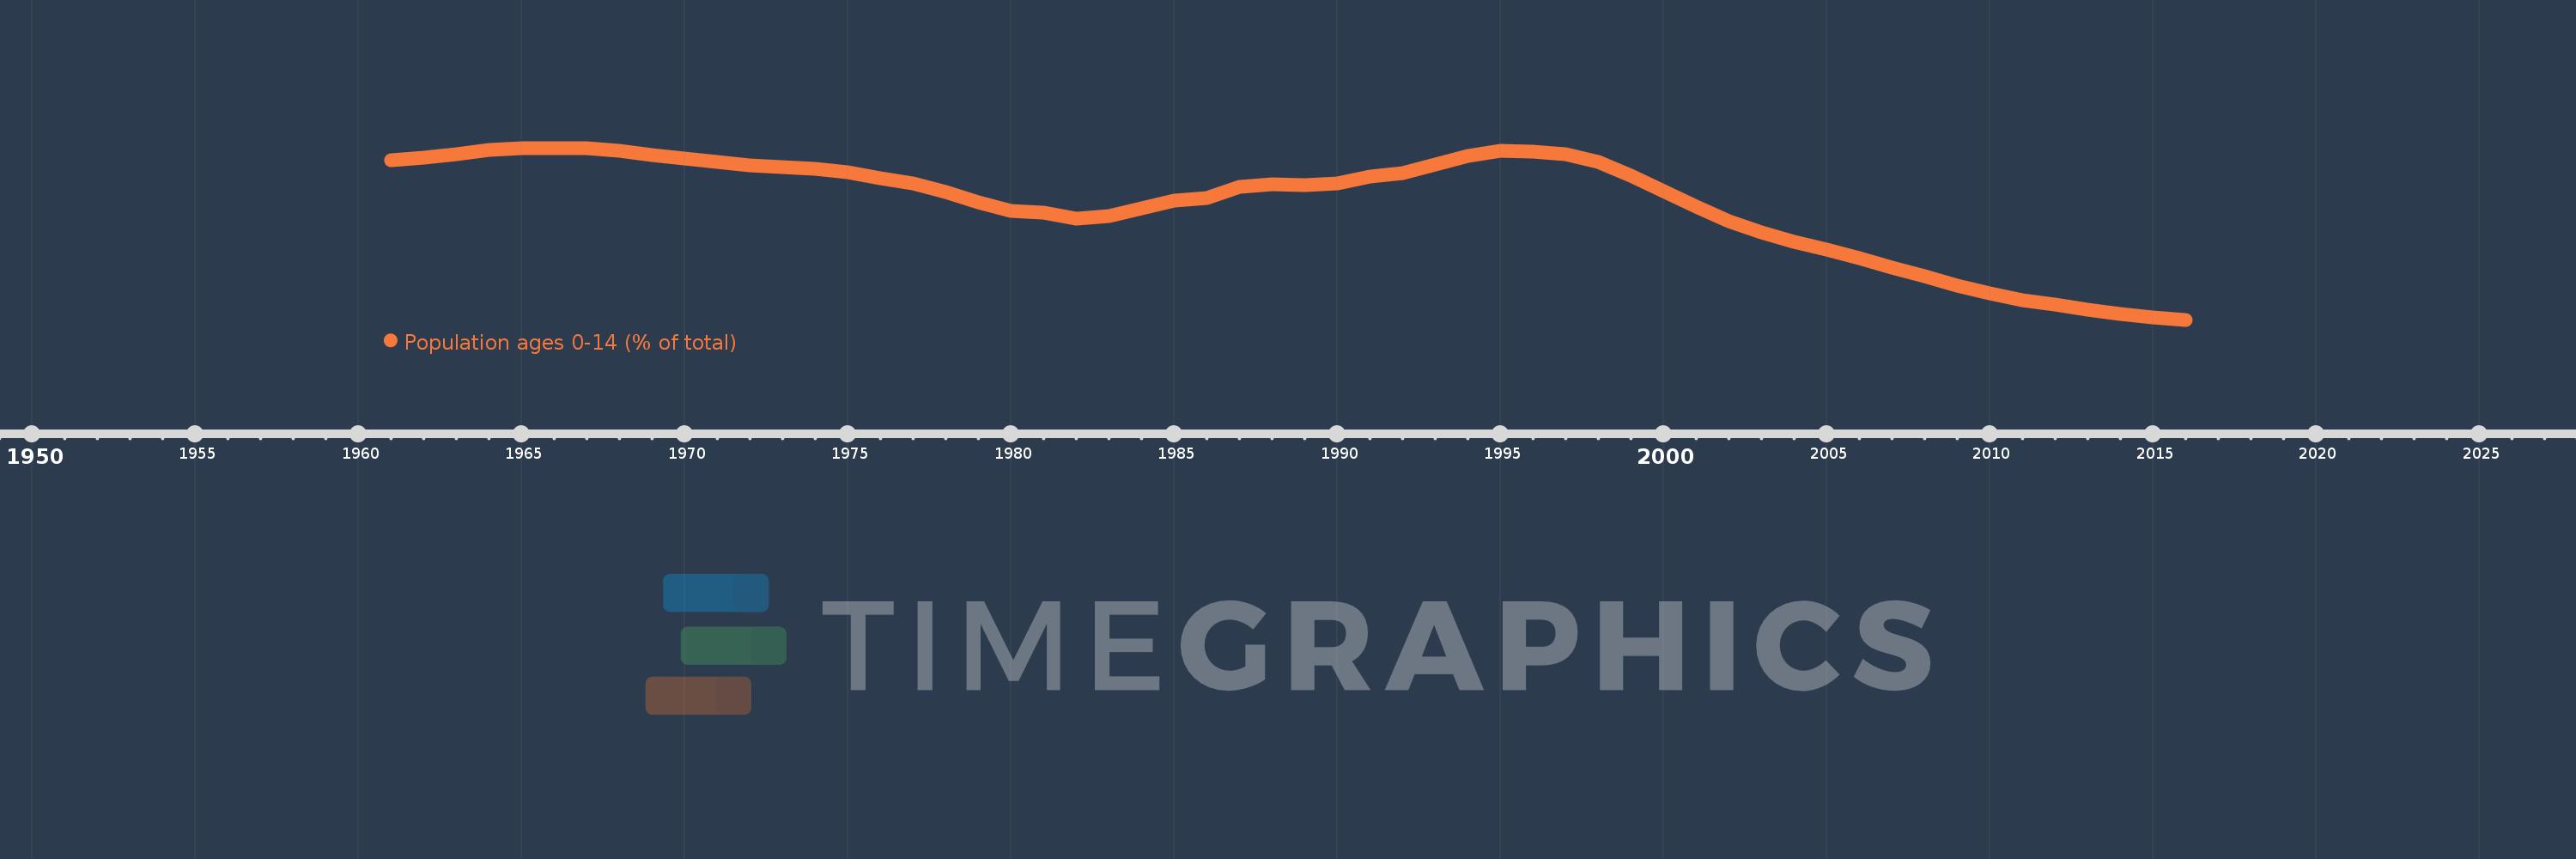
Population ages 0-14 (% of total)
2016,2015,2014,2013,2012,2011,2010,2009,2008,2007,2006,2005,2004,2003,2002,2001,2000,1999,1998,1997,1996,1995,1994,1993,1992,1991,1990,1989,1988,1987,1986,1985,1984,1983,1982,1981,1980,1979,1978,1977,1976,1975,1974,1973,1972,1971,1970,1969,1968,1967,1966,1965,1964,1963,1962,1961
This statistics in other country:
AfghanistanAlbaniaAlgeriaAngolaAntigua and BarbudaArab WorldArgentinaArmeniaArubaAustraliaAustriaAzerbaijanBahamas, TheBahrainBangladeshBarbadosBelarusBelgiumBelizeBeninBhutanBoliviaBosnia and HerzegovinaBotswanaBrazilBrunei DarussalamBulgariaBurkina FasoBurundiCabo VerdeCambodiaCameroonCanadaCaribbean small statesCentral African RepublicCentral Europe and the BalticsChadChannel IslandsChileChinaColombiaComorosCongo, Dem. Rep.Congo, Rep.Costa RicaCote d'IvoireCroatiaCubaCuracaoCyprusCzech RepublicDenmarkDjiboutiDominican RepublicEarly-demographic dividendEast Asia & PacificEast Asia & Pacific (excluding high income)East Asia & Pacific (IDA & IBRD countries)EcuadorEgypt, Arab Rep.El SalvadorEquatorial GuineaEritreaEstoniaEthiopiaEuro areaEurope & Central AsiaEurope & Central Asia (excluding high income)Europe & Central Asia (IDA & IBRD countries)European UnionFijiFinlandFragile and conflict affected situationsFranceFrench PolynesiaGabonGambia, TheGeorgiaGermanyGhanaGreeceGrenadaGuamGuatemalaGuineaGuinea-BissauGuyanaHaitiHeavily indebted poor countries (HIPC)High incomeHondurasHong Kong SAR, ChinaHungaryIBRD onlyIcelandIDA & IBRD totalIDA blendIDA onlyIDA totalIndiaIndonesiaIran, Islamic Rep.IraqIrelandIsraelItalyJamaicaJapanJordanKazakhstanKenyaKiribatiKorea, Dem. People’s Rep.Korea, Rep.KosovoKuwaitKyrgyz RepublicLao PDRLate-demographic dividendLatin America & Caribbean Latin America & Caribbean (excluding high income)Latin America & the Caribbean (IDA & IBRD countries)LatviaLeast developed countries: UN classificationLebanonLesothoLiberiaLibyaLithuaniaLow & middle incomeLow incomeLower middle incomeLuxembourgMacao SAR, ChinaMacedonia, FYRMadagascarMalawiMalaysiaMaldivesMaliMaltaMauritaniaMauritiusMexicoMicronesia, Fed. Sts.Middle East & North AfricaMiddle East & North Africa (excluding high income)Middle East & North Africa (IDA & IBRD countries)Middle incomeMoldovaMongoliaMontenegroMoroccoMozambiqueMyanmarNamibiaNepalNetherlandsNew CaledoniaNew ZealandNicaraguaNigerNigeriaNorth AmericaNorwayOECD membersOmanOther small statesPacific island small statesPakistanPanamaPapua New GuineaParaguayPeruPhilippinesPolandPortugalPost-demographic dividendPre-demographic dividendPuerto RicoQatarRomaniaRussian FederationRwandaSamoaSao Tome and PrincipeSaudi ArabiaSenegalSerbiaSeychellesSierra LeoneSingaporeSlovak RepublicSloveniaSmall statesSolomon IslandsSomaliaSouth AfricaSouth AsiaSouth Asia (IDA & IBRD)South SudanSpainSri LankaSt. LuciaSt. Vincent and the GrenadinesSub-Saharan Africa Sub-Saharan Africa (excluding high income)Sub-Saharan Africa (IDA & IBRD countries)SudanSurinameSwazilandSwedenSwitzerlandSyrian Arab RepublicTajikistanTanzaniaThailandTimor-LesteTogoTongaTrinidad and TobagoTunisiaTurkeyTurkmenistanUgandaUkraineUnited Arab EmiratesUnited KingdomUnited StatesUpper middle incomeUruguayUzbekistanVanuatuVenezuela, RBVietnamVirgin Islands (U.S.)West Bank and GazaWorldYemen, Rep.ZambiaZimbabwe Timeline:
This timeline shows a graph from 1961 to 2016 of Cambodia. No data until 1960. Number of actual observations by date: 56.
Source name:
World Development Indicators
Source organization:
World Bank staff estimates based on age distributions of United Nations Population Division's World Population Prospects.
Categories, topics:
Education, Health
Last updated:
apr 23, 2017
Indicators value changes by year
Minimum:
31.602
jan 1, 2016
At the date of observation
Value
Absolute change
Change from previous value
jan 1, 1961
45.743
+45.743
0.0%
jan 1, 1962
45.963
+0.219
0.48%
jan 1, 1963
46.293
+0.331
0.72%
jan 1, 1964
46.631
+0.338
0.73%
jan 1, 1965
46.82
+0.189
0.41%
jan 1, 1966
46.79
-0.03
-0.06%
jan 1, 1967
46.782
-0.008
-0.02%
jan 1, 1968
46.571
-0.211
-0.45%
jan 1, 1969
46.222
-0.35
-0.75%
jan 1, 1970
45.859
-0.363
-0.78%
jan 1, 1971
45.56
-0.298
-0.65%
jan 1, 1972
45.284
-0.276
-0.61%
jan 1, 1973
45.109
-0.176
-0.39%
jan 1, 1974
44.968
-0.14
-0.31%
jan 1, 1975
44.69
-0.279
-0.62%
jan 1, 1976
44.13
-0.559
-1.25%
jan 1, 1977
43.679
-0.451
-1.02%
jan 1, 1978
42.909
-0.77
-1.76%
jan 1, 1979
41.967
-0.942
-2.2%
jan 1, 1980
41.244
-0.723
-1.72%
jan 1, 1981
41.083
-0.161
-0.39%
jan 1, 1982
40.529
-0.554
-1.35%
jan 1, 1983
40.781
+0.252
0.62%
jan 1, 1984
41.497
+0.715
1.75%
jan 1, 1985
42.123
+0.626
1.51%
jan 1, 1986
42.418
+0.295
0.7%
jan 1, 1987
43.353
+0.935
2.2%
jan 1, 1988
43.582
+0.229
0.53%
jan 1, 1989
43.514
-0.068
-0.16%
jan 1, 1990
43.681
+0.168
0.39%
jan 1, 1991
44.279
+0.598
1.37%
jan 1, 1992
44.624
+0.345
0.78%
jan 1, 1993
45.329
+0.704
1.58%
jan 1, 1994
46.109
+0.78
1.72%
jan 1, 1995
46.551
+0.442
0.96%
jan 1, 1996
46.475
-0.075
-0.16%
jan 1, 1997
46.282
-0.193
-0.42%
jan 1, 1998
45.556
-0.726
-1.57%
jan 1, 1999
44.373
-1.183
-2.6%
jan 1, 2000
42.984
-1.389
-3.13%
jan 1, 2001
41.597
-1.388
-3.23%
jan 1, 2002
40.345
-1.251
-3.01%
jan 1, 2003
39.339
-1.006
-2.49%
jan 1, 2004
38.541
-0.798
-2.03%
jan 1, 2005
37.819
-0.722
-1.87%
jan 1, 2006
37.067
-0.751
-1.99%
jan 1, 2007
36.243
-0.825
-2.22%
jan 1, 2008
35.43
-0.813
-2.24%
jan 1, 2009
34.634
-0.796
-2.25%
jan 1, 2010
33.917
-0.717
-2.07%
jan 1, 2011
33.327
-0.59
-1.74%
jan 1, 2012
32.919
-0.408
-1.22%
jan 1, 2013
32.491
-0.429
-1.3%
jan 1, 2014
32.102
-0.388
-1.2%
jan 1, 2015
31.804
-0.298
-0.93%
jan 1, 2016
31.602
-0.202
-0.63%
Ranking of countries by current statistics by years


Comments: