29
/
en
AIzaSyAYiBZKx7MnpbEhh9jyipgxe19OcubqV5w
April 1, 2024
28521
East Asia & Pacific (excluding high income)
EAP
false
2
1
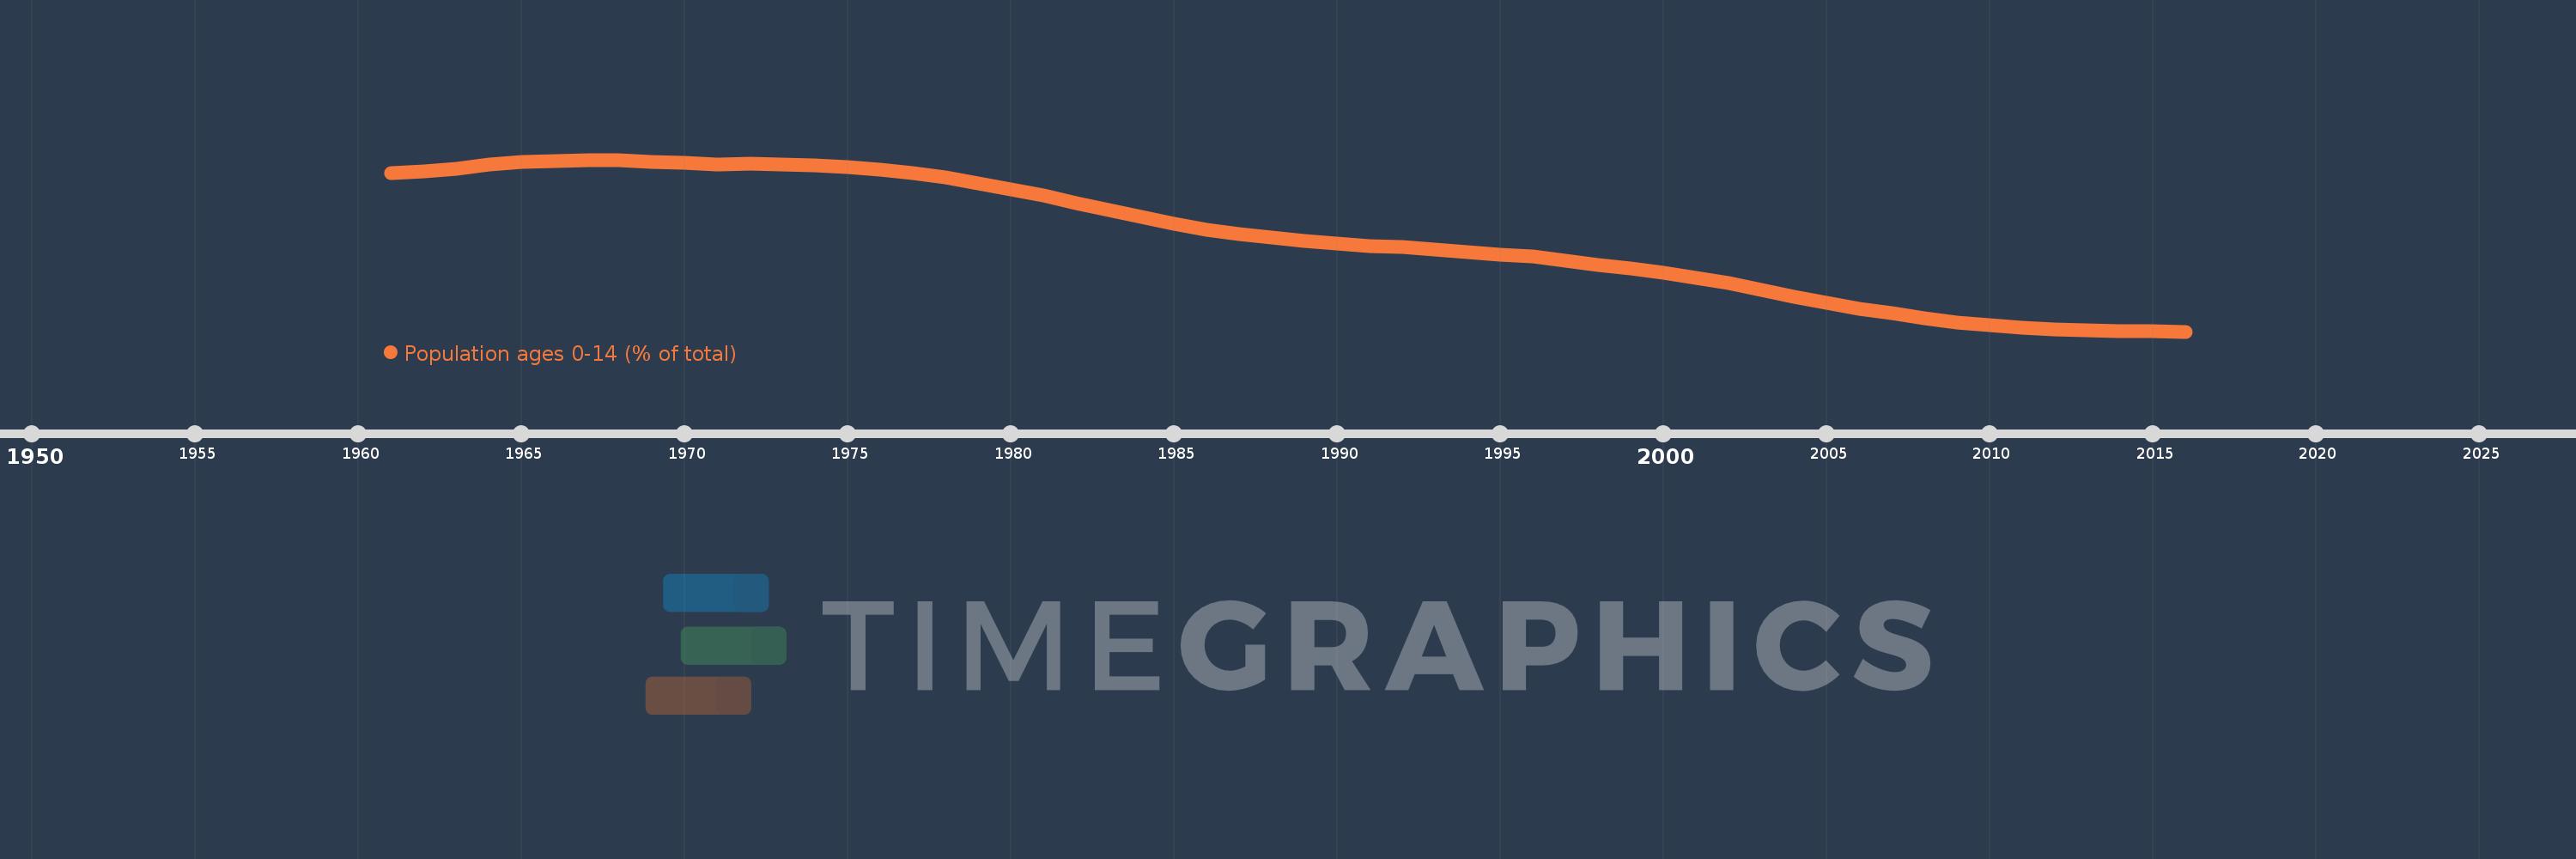
Population ages 0-14 (% of total)
2016,2015,2014,2013,2012,2011,2010,2009,2008,2007,2006,2005,2004,2003,2002,2001,2000,1999,1998,1997,1996,1995,1994,1993,1992,1991,1990,1989,1988,1987,1986,1985,1984,1983,1982,1981,1980,1979,1978,1977,1976,1975,1974,1973,1972,1971,1970,1969,1968,1967,1966,1965,1964,1963,1962,1961
This statistics in other country:
AfghanistanAlbaniaAlgeriaAngolaAntigua and BarbudaArab WorldArgentinaArmeniaArubaAustraliaAustriaAzerbaijanBahamas, TheBahrainBangladeshBarbadosBelarusBelgiumBelizeBeninBhutanBoliviaBosnia and HerzegovinaBotswanaBrazilBrunei DarussalamBulgariaBurkina FasoBurundiCabo VerdeCambodiaCameroonCanadaCaribbean small statesCentral African RepublicCentral Europe and the BalticsChadChannel IslandsChileChinaColombiaComorosCongo, Dem. Rep.Congo, Rep.Costa RicaCote d'IvoireCroatiaCubaCuracaoCyprusCzech RepublicDenmarkDjiboutiDominican RepublicEarly-demographic dividendEast Asia & PacificEast Asia & Pacific (excluding high income)East Asia & Pacific (IDA & IBRD countries)EcuadorEgypt, Arab Rep.El SalvadorEquatorial GuineaEritreaEstoniaEthiopiaEuro areaEurope & Central AsiaEurope & Central Asia (excluding high income)Europe & Central Asia (IDA & IBRD countries)European UnionFijiFinlandFragile and conflict affected situationsFranceFrench PolynesiaGabonGambia, TheGeorgiaGermanyGhanaGreeceGrenadaGuamGuatemalaGuineaGuinea-BissauGuyanaHaitiHeavily indebted poor countries (HIPC)High incomeHondurasHong Kong SAR, ChinaHungaryIBRD onlyIcelandIDA & IBRD totalIDA blendIDA onlyIDA totalIndiaIndonesiaIran, Islamic Rep.IraqIrelandIsraelItalyJamaicaJapanJordanKazakhstanKenyaKiribatiKorea, Dem. People’s Rep.Korea, Rep.KosovoKuwaitKyrgyz RepublicLao PDRLate-demographic dividendLatin America & Caribbean Latin America & Caribbean (excluding high income)Latin America & the Caribbean (IDA & IBRD countries)LatviaLeast developed countries: UN classificationLebanonLesothoLiberiaLibyaLithuaniaLow & middle incomeLow incomeLower middle incomeLuxembourgMacao SAR, ChinaMacedonia, FYRMadagascarMalawiMalaysiaMaldivesMaliMaltaMauritaniaMauritiusMexicoMicronesia, Fed. Sts.Middle East & North AfricaMiddle East & North Africa (excluding high income)Middle East & North Africa (IDA & IBRD countries)Middle incomeMoldovaMongoliaMontenegroMoroccoMozambiqueMyanmarNamibiaNepalNetherlandsNew CaledoniaNew ZealandNicaraguaNigerNigeriaNorth AmericaNorwayOECD membersOmanOther small statesPacific island small statesPakistanPanamaPapua New GuineaParaguayPeruPhilippinesPolandPortugalPost-demographic dividendPre-demographic dividendPuerto RicoQatarRomaniaRussian FederationRwandaSamoaSao Tome and PrincipeSaudi ArabiaSenegalSerbiaSeychellesSierra LeoneSingaporeSlovak RepublicSloveniaSmall statesSolomon IslandsSomaliaSouth AfricaSouth AsiaSouth Asia (IDA & IBRD)South SudanSpainSri LankaSt. LuciaSt. Vincent and the GrenadinesSub-Saharan Africa Sub-Saharan Africa (excluding high income)Sub-Saharan Africa (IDA & IBRD countries)SudanSurinameSwazilandSwedenSwitzerlandSyrian Arab RepublicTajikistanTanzaniaThailandTimor-LesteTogoTongaTrinidad and TobagoTunisiaTurkeyTurkmenistanUgandaUkraineUnited Arab EmiratesUnited KingdomUnited StatesUpper middle incomeUruguayUzbekistanVanuatuVenezuela, RBVietnamVirgin Islands (U.S.)West Bank and GazaWorldYemen, Rep.ZambiaZimbabwe Timeline:
This timeline shows a graph from 1961 to 2016 of East Asia & Pacific (excluding high income). No data until 1960. Number of actual observations by date: 56.
Source name:
World Development Indicators
Source organization:
World Bank staff estimates based on age distributions of United Nations Population Division's World Population Prospects.
Categories, topics:
Education, Health
Last updated:
apr 23, 2017
Indicators value changes by year
Minimum:
20.295
jan 1, 2016
Maximum:
42.031
jan 1, 1967
At the date of observation
Value
Absolute change
Change from previous value
jan 1, 1961
40.333
+40.333
0.0%
jan 1, 1962
40.518
+0.185
0.46%
jan 1, 1963
40.929
+0.412
1.02%
jan 1, 1964
41.399
+0.47
1.15%
jan 1, 1965
41.721
+0.322
0.78%
jan 1, 1966
41.827
+0.106
0.25%
jan 1, 1967
42.031
+0.204
0.49%
jan 1, 1968
41.986
-0.045
-0.11%
jan 1, 1969
41.798
-0.188
-0.45%
jan 1, 1970
41.611
-0.187
-0.45%
jan 1, 1971
41.48
-0.131
-0.31%
jan 1, 1972
41.495
+0.016
0.04%
jan 1, 1973
41.447
-0.048
-0.12%
jan 1, 1974
41.341
-0.106
-0.26%
jan 1, 1975
41.143
-0.199
-0.48%
jan 1, 1976
40.819
-0.324
-0.79%
jan 1, 1977
40.334
-0.485
-1.19%
jan 1, 1978
39.757
-0.578
-1.43%
jan 1, 1979
39.081
-0.676
-1.7%
jan 1, 1980
38.319
-0.761
-1.95%
jan 1, 1981
37.5
-0.82
-2.14%
jan 1, 1982
36.553
-0.947
-2.52%
jan 1, 1983
35.647
-0.906
-2.48%
jan 1, 1984
34.774
-0.874
-2.45%
jan 1, 1985
33.941
-0.832
-2.39%
jan 1, 1986
33.177
-0.765
-2.25%
jan 1, 1987
32.643
-0.533
-1.61%
jan 1, 1988
32.171
-0.472
-1.45%
jan 1, 1989
31.765
-0.406
-1.26%
jan 1, 1990
31.406
-0.359
-1.13%
jan 1, 1991
31.061
-0.345
-1.1%
jan 1, 1992
30.962
-0.099
-0.32%
jan 1, 1993
30.712
-0.25
-0.81%
jan 1, 1994
30.386
-0.326
-1.06%
jan 1, 1995
30.065
-0.32
-1.05%
jan 1, 1996
29.77
-0.295
-0.98%
jan 1, 1997
29.207
-0.563
-1.89%
jan 1, 1998
28.76
-0.446
-1.53%
jan 1, 1999
28.329
-0.431
-1.5%
jan 1, 2000
27.785
-0.545
-1.92%
jan 1, 2001
27.098
-0.687
-2.47%
jan 1, 2002
26.386
-0.712
-2.63%
jan 1, 2003
25.591
-0.795
-3.01%
jan 1, 2004
24.747
-0.844
-3.3%
jan 1, 2005
23.931
-0.816
-3.3%
jan 1, 2006
23.187
-0.743
-3.11%
jan 1, 2007
22.582
-0.606
-2.61%
jan 1, 2008
22.0
-0.582
-2.58%
jan 1, 2009
21.482
-0.518
-2.36%
jan 1, 2010
21.066
-0.416
-1.94%
jan 1, 2011
20.764
-0.302
-1.43%
jan 1, 2012
20.531
-0.233
-1.12%
jan 1, 2013
20.413
-0.118
-0.58%
jan 1, 2014
20.37
-0.042
-0.21%
jan 1, 2015
20.345
-0.026
-0.13%
jan 1, 2016
20.295
-0.049
-0.24%
Ranking of countries by current statistics by years


Comments: