29
/
en
AIzaSyAYiBZKx7MnpbEhh9jyipgxe19OcubqV5w
April 1, 2024
193470
Mauritania
MRT
true
2
1
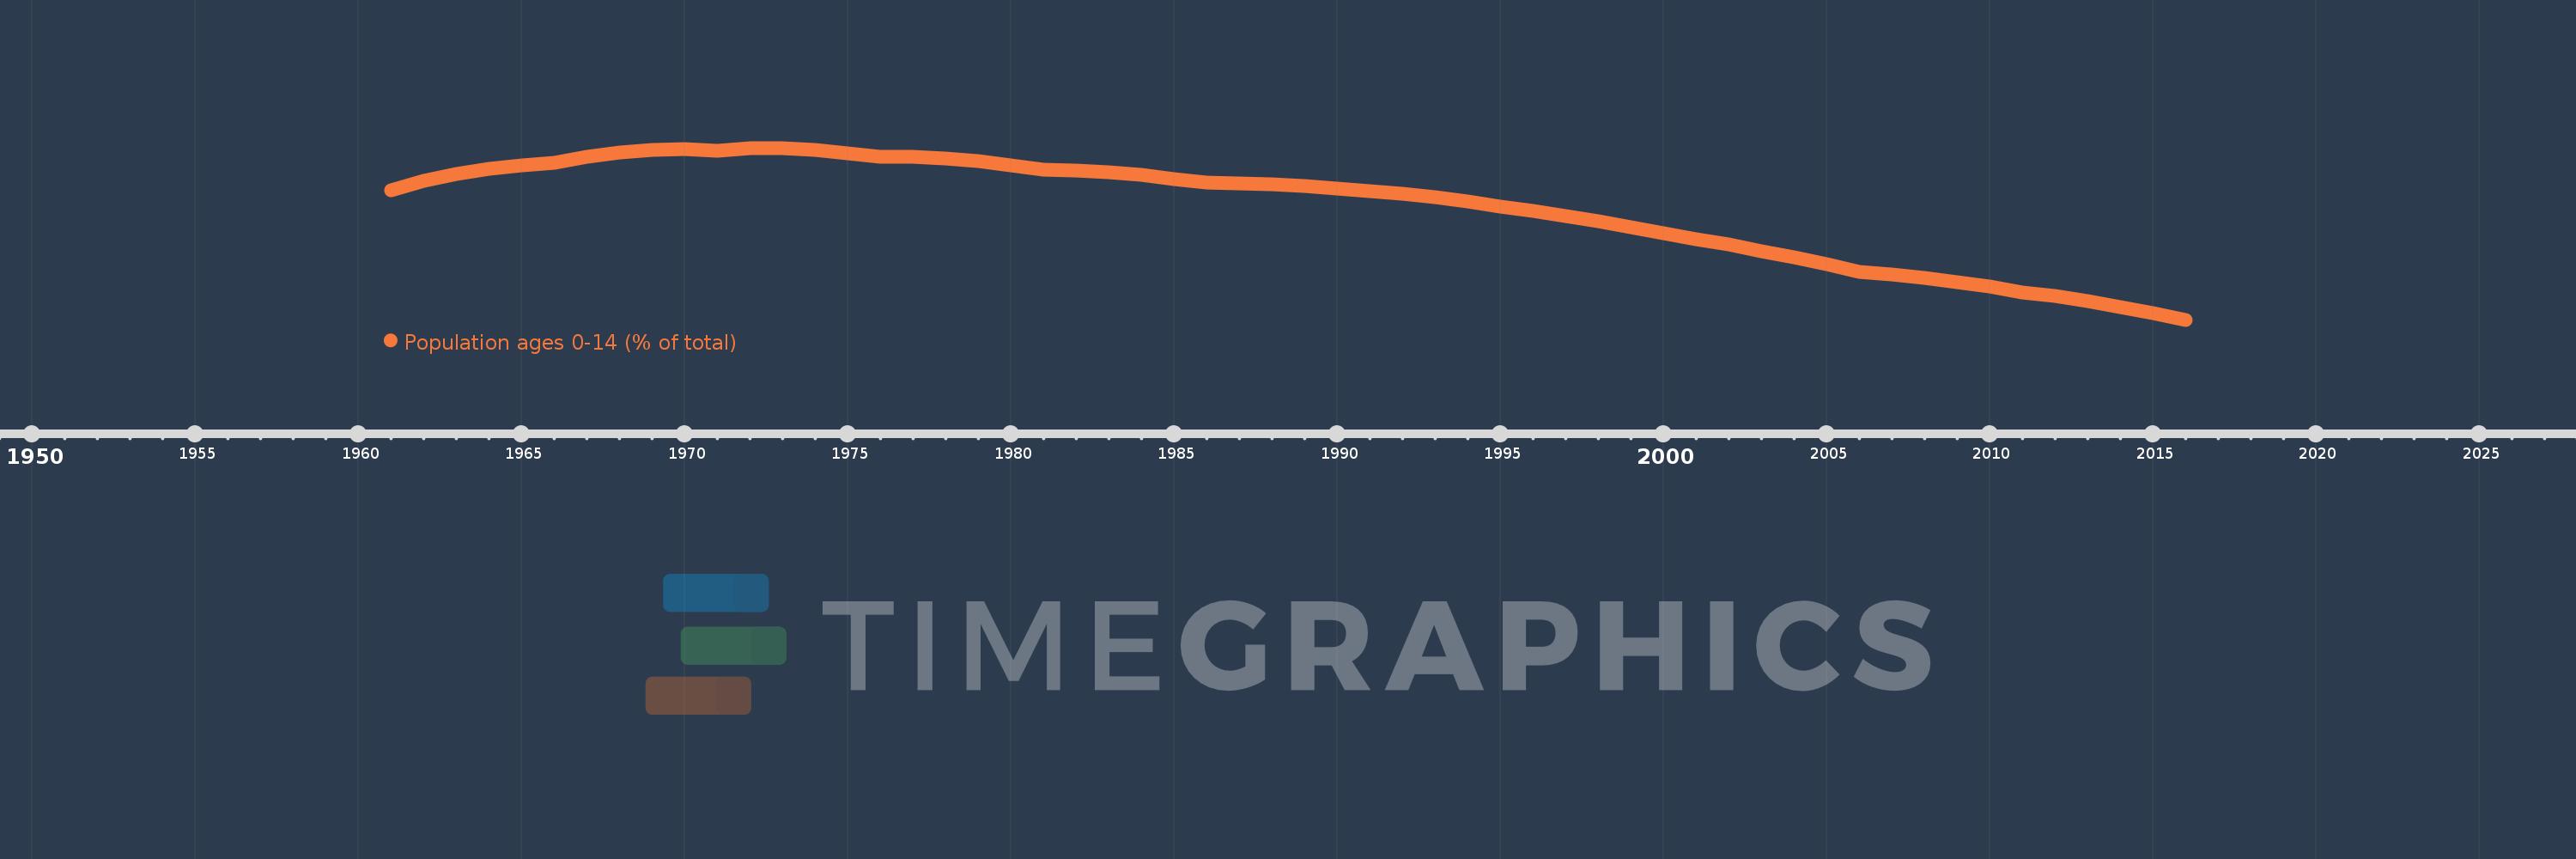
Population ages 0-14 (% of total)
2016,2015,2014,2013,2012,2011,2010,2009,2008,2007,2006,2005,2004,2003,2002,2001,2000,1999,1998,1997,1996,1995,1994,1993,1992,1991,1990,1989,1988,1987,1986,1985,1984,1983,1982,1981,1980,1979,1978,1977,1976,1975,1974,1973,1972,1971,1970,1969,1968,1967,1966,1965,1964,1963,1962,1961
This statistics in other country:
AfghanistanAlbaniaAlgeriaAngolaAntigua and BarbudaArab WorldArgentinaArmeniaArubaAustraliaAustriaAzerbaijanBahamas, TheBahrainBangladeshBarbadosBelarusBelgiumBelizeBeninBhutanBoliviaBosnia and HerzegovinaBotswanaBrazilBrunei DarussalamBulgariaBurkina FasoBurundiCabo VerdeCambodiaCameroonCanadaCaribbean small statesCentral African RepublicCentral Europe and the BalticsChadChannel IslandsChileChinaColombiaComorosCongo, Dem. Rep.Congo, Rep.Costa RicaCote d'IvoireCroatiaCubaCuracaoCyprusCzech RepublicDenmarkDjiboutiDominican RepublicEarly-demographic dividendEast Asia & PacificEast Asia & Pacific (excluding high income)East Asia & Pacific (IDA & IBRD countries)EcuadorEgypt, Arab Rep.El SalvadorEquatorial GuineaEritreaEstoniaEthiopiaEuro areaEurope & Central AsiaEurope & Central Asia (excluding high income)Europe & Central Asia (IDA & IBRD countries)European UnionFijiFinlandFragile and conflict affected situationsFranceFrench PolynesiaGabonGambia, TheGeorgiaGermanyGhanaGreeceGrenadaGuamGuatemalaGuineaGuinea-BissauGuyanaHaitiHeavily indebted poor countries (HIPC)High incomeHondurasHong Kong SAR, ChinaHungaryIBRD onlyIcelandIDA & IBRD totalIDA blendIDA onlyIDA totalIndiaIndonesiaIran, Islamic Rep.IraqIrelandIsraelItalyJamaicaJapanJordanKazakhstanKenyaKiribatiKorea, Dem. People’s Rep.Korea, Rep.KosovoKuwaitKyrgyz RepublicLao PDRLate-demographic dividendLatin America & Caribbean Latin America & Caribbean (excluding high income)Latin America & the Caribbean (IDA & IBRD countries)LatviaLeast developed countries: UN classificationLebanonLesothoLiberiaLibyaLithuaniaLow & middle incomeLow incomeLower middle incomeLuxembourgMacao SAR, ChinaMacedonia, FYRMadagascarMalawiMalaysiaMaldivesMaliMaltaMauritaniaMauritiusMexicoMicronesia, Fed. Sts.Middle East & North AfricaMiddle East & North Africa (excluding high income)Middle East & North Africa (IDA & IBRD countries)Middle incomeMoldovaMongoliaMontenegroMoroccoMozambiqueMyanmarNamibiaNepalNetherlandsNew CaledoniaNew ZealandNicaraguaNigerNigeriaNorth AmericaNorwayOECD membersOmanOther small statesPacific island small statesPakistanPanamaPapua New GuineaParaguayPeruPhilippinesPolandPortugalPost-demographic dividendPre-demographic dividendPuerto RicoQatarRomaniaRussian FederationRwandaSamoaSao Tome and PrincipeSaudi ArabiaSenegalSerbiaSeychellesSierra LeoneSingaporeSlovak RepublicSloveniaSmall statesSolomon IslandsSomaliaSouth AfricaSouth AsiaSouth Asia (IDA & IBRD)South SudanSpainSri LankaSt. LuciaSt. Vincent and the GrenadinesSub-Saharan Africa Sub-Saharan Africa (excluding high income)Sub-Saharan Africa (IDA & IBRD countries)SudanSurinameSwazilandSwedenSwitzerlandSyrian Arab RepublicTajikistanTanzaniaThailandTimor-LesteTogoTongaTrinidad and TobagoTunisiaTurkeyTurkmenistanUgandaUkraineUnited Arab EmiratesUnited KingdomUnited StatesUpper middle incomeUruguayUzbekistanVanuatuVenezuela, RBVietnamVirgin Islands (U.S.)West Bank and GazaWorldYemen, Rep.ZambiaZimbabwe Timeline:
This timeline shows a graph from 1961 to 2016 of Mauritania. No data until 1960. Number of actual observations by date: 56.
Source name:
World Development Indicators
Source organization:
World Bank staff estimates based on age distributions of United Nations Population Division's World Population Prospects.
Categories, topics:
Education, Health
Last updated:
apr 23, 2017
Indicators value changes by year
Minimum:
40.016
jan 1, 2016
Maximum:
46.115
jan 1, 1973
At the date of observation
Value
Absolute change
Change from previous value
jan 1, 1961
44.615
+44.615
0.0%
jan 1, 1962
44.957
+0.343
0.77%
jan 1, 1963
45.2
+0.243
0.54%
jan 1, 1964
45.373
+0.172
0.38%
jan 1, 1965
45.5
+0.127
0.28%
jan 1, 1966
45.591
+0.091
0.2%
jan 1, 1967
45.805
+0.213
0.47%
jan 1, 1968
45.959
+0.154
0.34%
jan 1, 1969
46.052
+0.093
0.2%
jan 1, 1970
46.074
+0.022
0.05%
jan 1, 1971
46.026
-0.048
-0.1%
jan 1, 1972
46.114
+0.088
0.19%
jan 1, 1973
46.115
+0.001
0.0%
jan 1, 1974
46.048
-0.067
-0.14%
jan 1, 1975
45.937
-0.111
-0.24%
jan 1, 1976
45.796
-0.142
-0.31%
jan 1, 1977
45.797
+0.001
0.0%
jan 1, 1978
45.739
-0.058
-0.13%
jan 1, 1979
45.638
-0.101
-0.22%
jan 1, 1980
45.504
-0.133
-0.29%
jan 1, 1981
45.346
-0.158
-0.35%
jan 1, 1982
45.322
-0.024
-0.05%
jan 1, 1983
45.253
-0.07
-0.15%
jan 1, 1984
45.149
-0.104
-0.23%
jan 1, 1985
45.022
-0.127
-0.28%
jan 1, 1986
44.878
-0.144
-0.32%
jan 1, 1987
44.866
-0.012
-0.03%
jan 1, 1988
44.831
-0.035
-0.08%
jan 1, 1989
44.772
-0.059
-0.13%
jan 1, 1990
44.687
-0.086
-0.19%
jan 1, 1991
44.575
-0.112
-0.25%
jan 1, 1992
44.49
-0.085
-0.19%
jan 1, 1993
44.362
-0.128
-0.29%
jan 1, 1994
44.206
-0.157
-0.35%
jan 1, 1995
44.037
-0.169
-0.38%
jan 1, 1996
43.865
-0.172
-0.39%
jan 1, 1997
43.693
-0.171
-0.39%
jan 1, 1998
43.507
-0.186
-0.43%
jan 1, 1999
43.309
-0.198
-0.45%
jan 1, 2000
43.099
-0.21
-0.48%
jan 1, 2001
42.878
-0.222
-0.51%
jan 1, 2002
42.68
-0.197
-0.46%
jan 1, 2003
42.461
-0.219
-0.51%
jan 1, 2004
42.225
-0.236
-0.56%
jan 1, 2005
41.975
-0.25
-0.59%
jan 1, 2006
41.712
-0.263
-0.63%
jan 1, 2007
41.619
-0.093
-0.22%
jan 1, 2008
41.498
-0.121
-0.29%
jan 1, 2009
41.351
-0.147
-0.35%
jan 1, 2010
41.181
-0.17
-0.41%
jan 1, 2011
40.992
-0.19
-0.46%
jan 1, 2012
40.849
-0.142
-0.35%
jan 1, 2013
40.677
-0.172
-0.42%
jan 1, 2014
40.479
-0.198
-0.49%
jan 1, 2015
40.258
-0.221
-0.54%
jan 1, 2016
40.016
-0.242
-0.6%
Ranking of countries by current statistics by years


Comments: