29
/
en
AIzaSyAYiBZKx7MnpbEhh9jyipgxe19OcubqV5w
April 1, 2024
266161
Tonga
TON
true
2
1
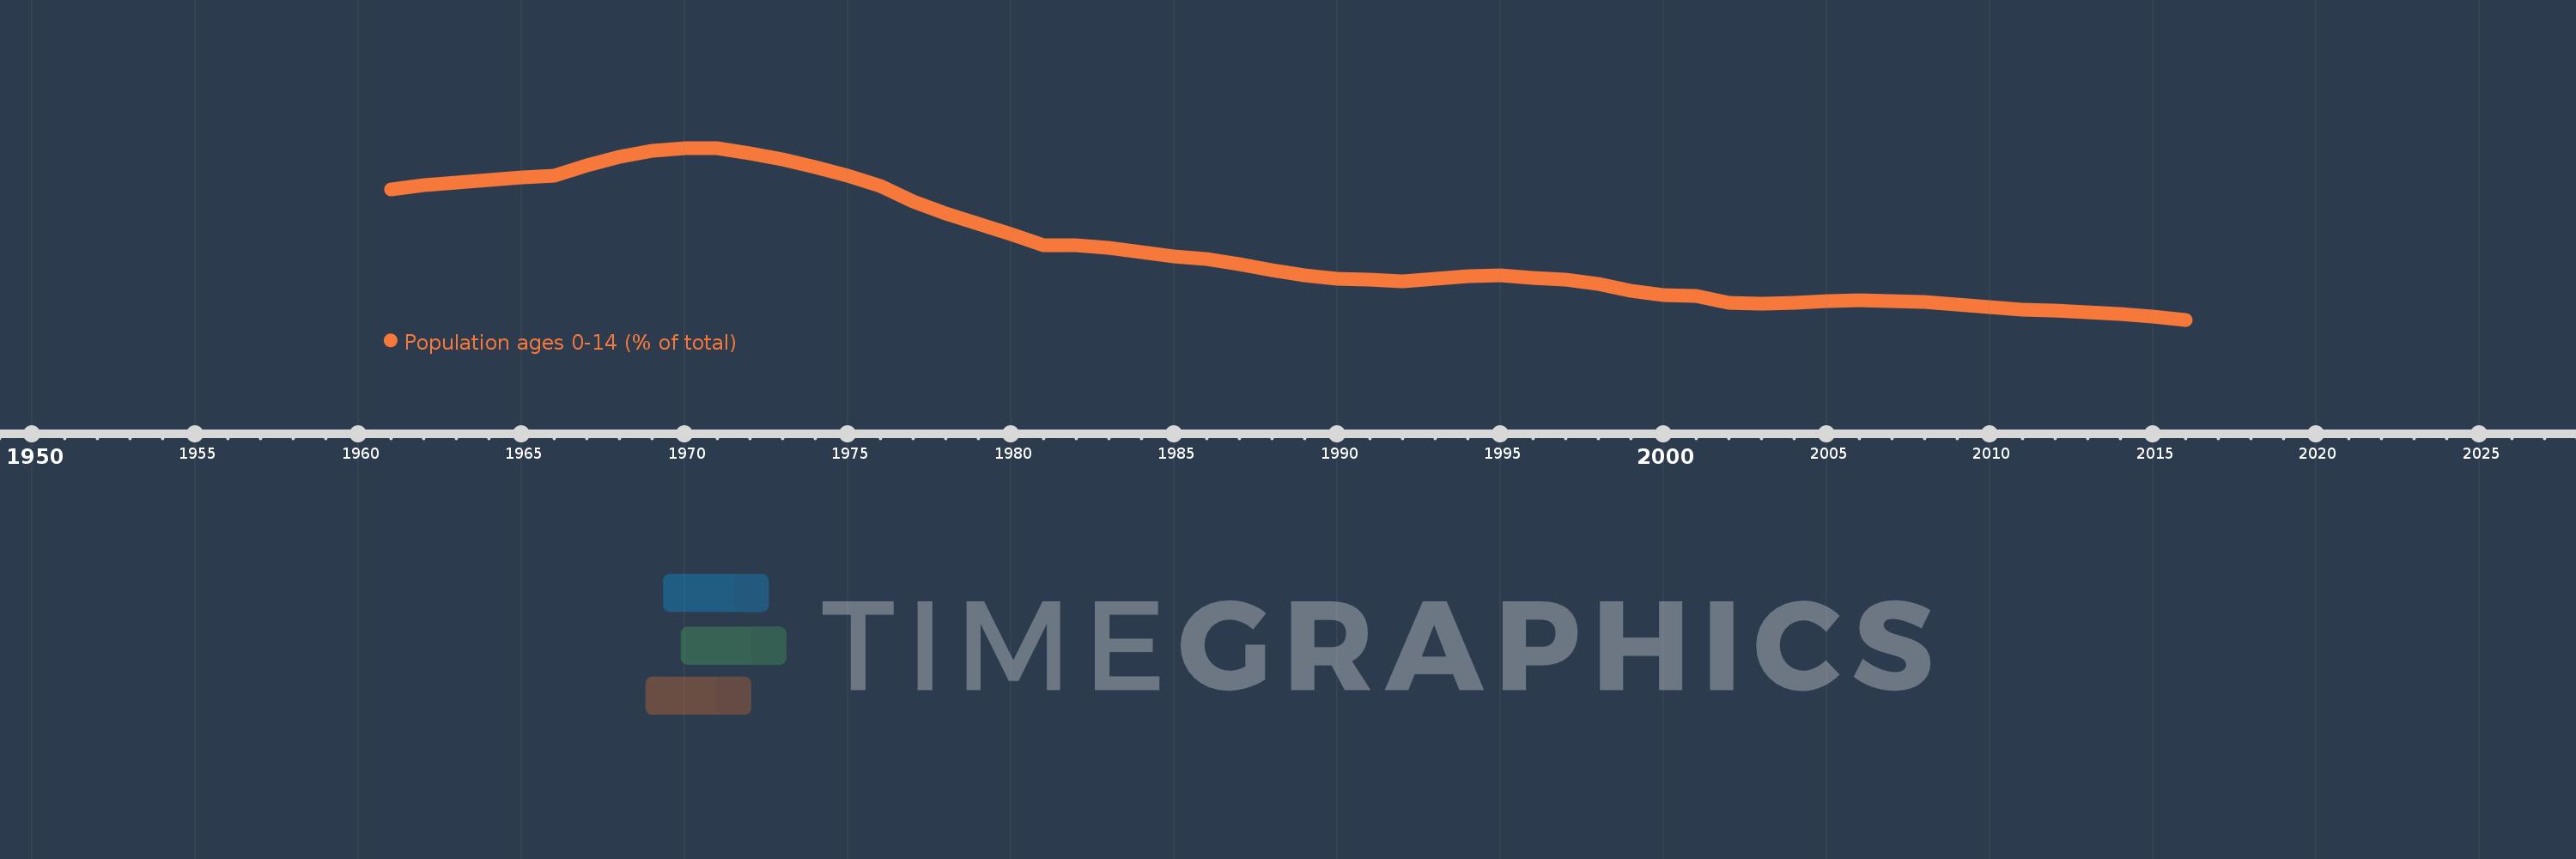
Population ages 0-14 (% of total)
2016,2015,2014,2013,2012,2011,2010,2009,2008,2007,2006,2005,2004,2003,2002,2001,2000,1999,1998,1997,1996,1995,1994,1993,1992,1991,1990,1989,1988,1987,1986,1985,1984,1983,1982,1981,1980,1979,1978,1977,1976,1975,1974,1973,1972,1971,1970,1969,1968,1967,1966,1965,1964,1963,1962,1961
This statistics in other country:
AfghanistanAlbaniaAlgeriaAngolaAntigua and BarbudaArab WorldArgentinaArmeniaArubaAustraliaAustriaAzerbaijanBahamas, TheBahrainBangladeshBarbadosBelarusBelgiumBelizeBeninBhutanBoliviaBosnia and HerzegovinaBotswanaBrazilBrunei DarussalamBulgariaBurkina FasoBurundiCabo VerdeCambodiaCameroonCanadaCaribbean small statesCentral African RepublicCentral Europe and the BalticsChadChannel IslandsChileChinaColombiaComorosCongo, Dem. Rep.Congo, Rep.Costa RicaCote d'IvoireCroatiaCubaCuracaoCyprusCzech RepublicDenmarkDjiboutiDominican RepublicEarly-demographic dividendEast Asia & PacificEast Asia & Pacific (excluding high income)East Asia & Pacific (IDA & IBRD countries)EcuadorEgypt, Arab Rep.El SalvadorEquatorial GuineaEritreaEstoniaEthiopiaEuro areaEurope & Central AsiaEurope & Central Asia (excluding high income)Europe & Central Asia (IDA & IBRD countries)European UnionFijiFinlandFragile and conflict affected situationsFranceFrench PolynesiaGabonGambia, TheGeorgiaGermanyGhanaGreeceGrenadaGuamGuatemalaGuineaGuinea-BissauGuyanaHaitiHeavily indebted poor countries (HIPC)High incomeHondurasHong Kong SAR, ChinaHungaryIBRD onlyIcelandIDA & IBRD totalIDA blendIDA onlyIDA totalIndiaIndonesiaIran, Islamic Rep.IraqIrelandIsraelItalyJamaicaJapanJordanKazakhstanKenyaKiribatiKorea, Dem. People’s Rep.Korea, Rep.KosovoKuwaitKyrgyz RepublicLao PDRLate-demographic dividendLatin America & Caribbean Latin America & Caribbean (excluding high income)Latin America & the Caribbean (IDA & IBRD countries)LatviaLeast developed countries: UN classificationLebanonLesothoLiberiaLibyaLithuaniaLow & middle incomeLow incomeLower middle incomeLuxembourgMacao SAR, ChinaMacedonia, FYRMadagascarMalawiMalaysiaMaldivesMaliMaltaMauritaniaMauritiusMexicoMicronesia, Fed. Sts.Middle East & North AfricaMiddle East & North Africa (excluding high income)Middle East & North Africa (IDA & IBRD countries)Middle incomeMoldovaMongoliaMontenegroMoroccoMozambiqueMyanmarNamibiaNepalNetherlandsNew CaledoniaNew ZealandNicaraguaNigerNigeriaNorth AmericaNorwayOECD membersOmanOther small statesPacific island small statesPakistanPanamaPapua New GuineaParaguayPeruPhilippinesPolandPortugalPost-demographic dividendPre-demographic dividendPuerto RicoQatarRomaniaRussian FederationRwandaSamoaSao Tome and PrincipeSaudi ArabiaSenegalSerbiaSeychellesSierra LeoneSingaporeSlovak RepublicSloveniaSmall statesSolomon IslandsSomaliaSouth AfricaSouth AsiaSouth Asia (IDA & IBRD)South SudanSpainSri LankaSt. LuciaSt. Vincent and the GrenadinesSub-Saharan Africa Sub-Saharan Africa (excluding high income)Sub-Saharan Africa (IDA & IBRD countries)SudanSurinameSwazilandSwedenSwitzerlandSyrian Arab RepublicTajikistanTanzaniaThailandTimor-LesteTogoTongaTrinidad and TobagoTunisiaTurkeyTurkmenistanUgandaUkraineUnited Arab EmiratesUnited KingdomUnited StatesUpper middle incomeUruguayUzbekistanVanuatuVenezuela, RBVietnamVirgin Islands (U.S.)West Bank and GazaWorldYemen, Rep.ZambiaZimbabwe Timeline:
This timeline shows a graph from 1961 to 2016 of Tonga. No data until 1960. Number of actual observations by date: 56.
Source name:
World Development Indicators
Source organization:
World Bank staff estimates based on age distributions of United Nations Population Division's World Population Prospects.
Categories, topics:
Education, Health
Last updated:
apr 23, 2017
Indicators value changes by year
Minimum:
36.764
jan 1, 2016
Maximum:
48.135
jan 1, 1970
At the date of observation
Value
Absolute change
Change from previous value
jan 1, 1961
45.407
+45.407
0.0%
jan 1, 1962
45.67
+0.262
0.58%
jan 1, 1963
45.856
+0.186
0.41%
jan 1, 1964
46.025
+0.168
0.37%
jan 1, 1965
46.172
+0.148
0.32%
jan 1, 1966
46.28
+0.107
0.23%
jan 1, 1967
46.99
+0.71
1.53%
jan 1, 1968
47.545
+0.555
1.18%
jan 1, 1969
47.935
+0.39
0.82%
jan 1, 1970
48.135
+0.201
0.42%
jan 1, 1971
48.121
-0.014
-0.03%
jan 1, 1972
47.801
-0.321
-0.67%
jan 1, 1973
47.389
-0.411
-0.86%
jan 1, 1974
46.878
-0.511
-1.08%
jan 1, 1975
46.273
-0.606
-1.29%
jan 1, 1976
45.594
-0.679
-1.47%
jan 1, 1977
44.62
-0.974
-2.14%
jan 1, 1978
43.8
-0.82
-1.84%
jan 1, 1979
43.092
-0.708
-1.62%
jan 1, 1980
42.416
-0.676
-1.57%
jan 1, 1981
41.701
-0.715
-1.69%
jan 1, 1982
41.699
-0.002
0.0%
jan 1, 1983
41.518
-0.182
-0.44%
jan 1, 1984
41.237
-0.281
-0.68%
jan 1, 1985
40.977
-0.26
-0.63%
jan 1, 1986
40.795
-0.182
-0.44%
jan 1, 1987
40.439
-0.356
-0.87%
jan 1, 1988
40.043
-0.396
-0.98%
jan 1, 1989
39.7
-0.343
-0.86%
jan 1, 1990
39.485
-0.215
-0.54%
jan 1, 1991
39.398
-0.087
-0.22%
jan 1, 1992
39.327
-0.071
-0.18%
jan 1, 1993
39.48
+0.153
0.39%
jan 1, 1994
39.67
+0.191
0.48%
jan 1, 1995
39.697
+0.026
0.07%
jan 1, 1996
39.507
-0.19
-0.48%
jan 1, 1997
39.443
-0.064
-0.16%
jan 1, 1998
39.113
-0.33
-0.84%
jan 1, 1999
38.683
-0.43
-1.1%
jan 1, 2000
38.386
-0.297
-0.77%
jan 1, 2001
38.32
-0.065
-0.17%
jan 1, 2002
37.902
-0.419
-1.09%
jan 1, 2003
37.799
-0.102
-0.27%
jan 1, 2004
37.895
+0.096
0.25%
jan 1, 2005
38.01
+0.115
0.3%
jan 1, 2006
38.044
+0.033
0.09%
jan 1, 2007
38.02
-0.024
-0.06%
jan 1, 2008
37.927
-0.093
-0.24%
jan 1, 2009
37.766
-0.161
-0.42%
jan 1, 2010
37.589
-0.178
-0.47%
jan 1, 2011
37.421
-0.168
-0.45%
jan 1, 2012
37.371
-0.05
-0.13%
jan 1, 2013
37.278
-0.092
-0.25%
jan 1, 2014
37.147
-0.131
-0.35%
jan 1, 2015
36.974
-0.173
-0.47%
jan 1, 2016
36.764
-0.21
-0.57%
Ranking of countries by current statistics by years


Comments: