29
/
en
AIzaSyAYiBZKx7MnpbEhh9jyipgxe19OcubqV5w
April 1, 2024
42812
Latin America & Caribbean (excluding high income)
LAC
false
2
1
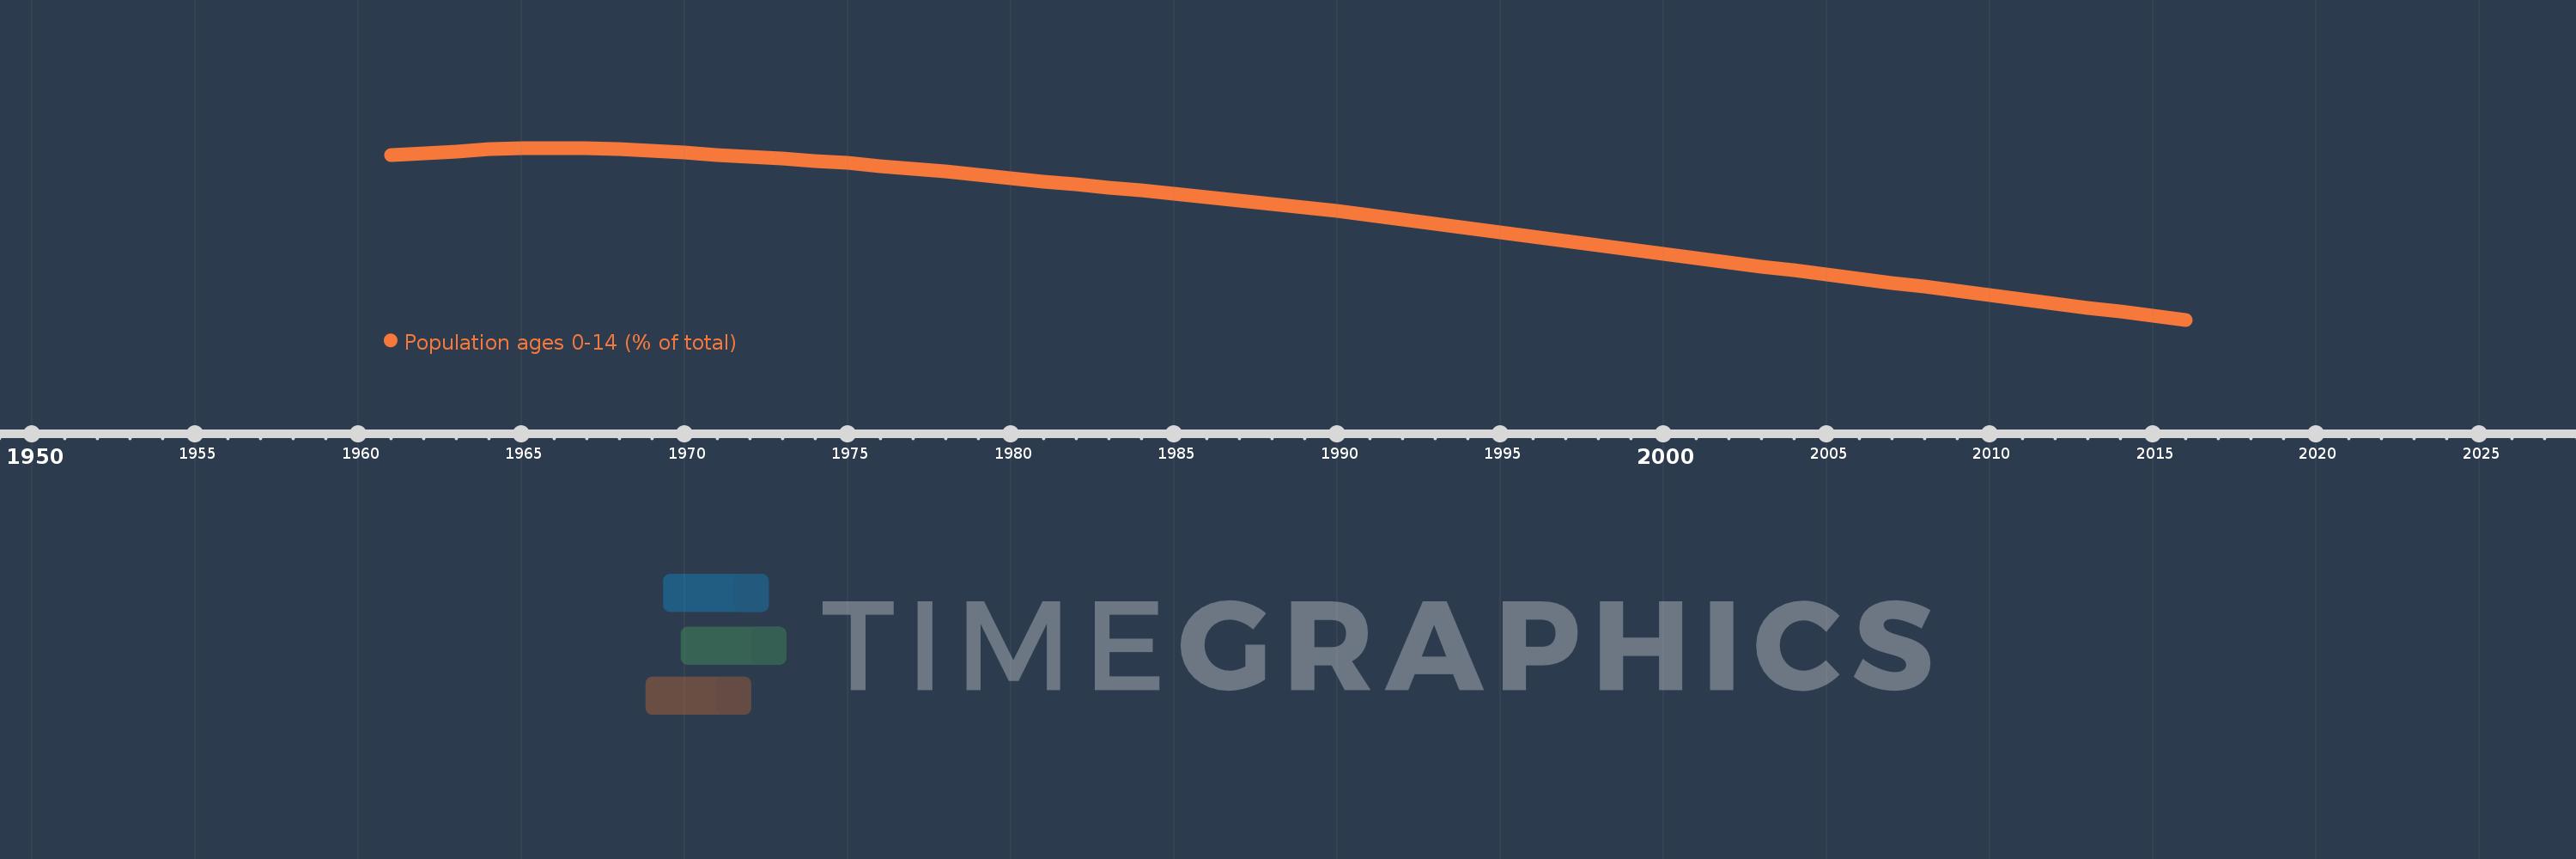
Population ages 0-14 (% of total)
2016,2015,2014,2013,2012,2011,2010,2009,2008,2007,2006,2005,2004,2003,2002,2001,2000,1999,1998,1997,1996,1995,1994,1993,1992,1991,1990,1989,1988,1987,1986,1985,1984,1983,1982,1981,1980,1979,1978,1977,1976,1975,1974,1973,1972,1971,1970,1969,1968,1967,1966,1965,1964,1963,1962,1961
This statistics in other country:
AfghanistanAlbaniaAlgeriaAngolaAntigua and BarbudaArab WorldArgentinaArmeniaArubaAustraliaAustriaAzerbaijanBahamas, TheBahrainBangladeshBarbadosBelarusBelgiumBelizeBeninBhutanBoliviaBosnia and HerzegovinaBotswanaBrazilBrunei DarussalamBulgariaBurkina FasoBurundiCabo VerdeCambodiaCameroonCanadaCaribbean small statesCentral African RepublicCentral Europe and the BalticsChadChannel IslandsChileChinaColombiaComorosCongo, Dem. Rep.Congo, Rep.Costa RicaCote d'IvoireCroatiaCubaCuracaoCyprusCzech RepublicDenmarkDjiboutiDominican RepublicEarly-demographic dividendEast Asia & PacificEast Asia & Pacific (excluding high income)East Asia & Pacific (IDA & IBRD countries)EcuadorEgypt, Arab Rep.El SalvadorEquatorial GuineaEritreaEstoniaEthiopiaEuro areaEurope & Central AsiaEurope & Central Asia (excluding high income)Europe & Central Asia (IDA & IBRD countries)European UnionFijiFinlandFragile and conflict affected situationsFranceFrench PolynesiaGabonGambia, TheGeorgiaGermanyGhanaGreeceGrenadaGuamGuatemalaGuineaGuinea-BissauGuyanaHaitiHeavily indebted poor countries (HIPC)High incomeHondurasHong Kong SAR, ChinaHungaryIBRD onlyIcelandIDA & IBRD totalIDA blendIDA onlyIDA totalIndiaIndonesiaIran, Islamic Rep.IraqIrelandIsraelItalyJamaicaJapanJordanKazakhstanKenyaKiribatiKorea, Dem. People’s Rep.Korea, Rep.KosovoKuwaitKyrgyz RepublicLao PDRLate-demographic dividendLatin America & Caribbean Latin America & Caribbean (excluding high income)Latin America & the Caribbean (IDA & IBRD countries)LatviaLeast developed countries: UN classificationLebanonLesothoLiberiaLibyaLithuaniaLow & middle incomeLow incomeLower middle incomeLuxembourgMacao SAR, ChinaMacedonia, FYRMadagascarMalawiMalaysiaMaldivesMaliMaltaMauritaniaMauritiusMexicoMicronesia, Fed. Sts.Middle East & North AfricaMiddle East & North Africa (excluding high income)Middle East & North Africa (IDA & IBRD countries)Middle incomeMoldovaMongoliaMontenegroMoroccoMozambiqueMyanmarNamibiaNepalNetherlandsNew CaledoniaNew ZealandNicaraguaNigerNigeriaNorth AmericaNorwayOECD membersOmanOther small statesPacific island small statesPakistanPanamaPapua New GuineaParaguayPeruPhilippinesPolandPortugalPost-demographic dividendPre-demographic dividendPuerto RicoQatarRomaniaRussian FederationRwandaSamoaSao Tome and PrincipeSaudi ArabiaSenegalSerbiaSeychellesSierra LeoneSingaporeSlovak RepublicSloveniaSmall statesSolomon IslandsSomaliaSouth AfricaSouth AsiaSouth Asia (IDA & IBRD)South SudanSpainSri LankaSt. LuciaSt. Vincent and the GrenadinesSub-Saharan Africa Sub-Saharan Africa (excluding high income)Sub-Saharan Africa (IDA & IBRD countries)SudanSurinameSwazilandSwedenSwitzerlandSyrian Arab RepublicTajikistanTanzaniaThailandTimor-LesteTogoTongaTrinidad and TobagoTunisiaTurkeyTurkmenistanUgandaUkraineUnited Arab EmiratesUnited KingdomUnited StatesUpper middle incomeUruguayUzbekistanVanuatuVenezuela, RBVietnamVirgin Islands (U.S.)West Bank and GazaWorldYemen, Rep.ZambiaZimbabwe Timeline:
This timeline shows a graph from 1961 to 2016 of Latin America & Caribbean (excluding high income). No data until 1960. Number of actual observations by date: 56.
Source name:
World Development Indicators
Source organization:
World Bank staff estimates based on age distributions of United Nations Population Division's World Population Prospects.
Categories, topics:
Education, Health
Last updated:
apr 23, 2017
Indicators value changes by year
Minimum:
25.981
jan 1, 2016
At the date of observation
Value
Absolute change
Change from previous value
jan 1, 1961
42.832
+42.832
0.0%
jan 1, 1962
43.029
+0.197
0.46%
jan 1, 1963
43.245
+0.216
0.5%
jan 1, 1964
43.437
+0.192
0.44%
jan 1, 1965
43.541
+0.104
0.24%
jan 1, 1966
43.529
-0.011
-0.03%
jan 1, 1967
43.59
+0.06
0.14%
jan 1, 1968
43.5
-0.09
-0.21%
jan 1, 1969
43.312
-0.188
-0.43%
jan 1, 1970
43.098
-0.214
-0.49%
jan 1, 1971
42.891
-0.207
-0.48%
jan 1, 1972
42.679
-0.212
-0.49%
jan 1, 1973
42.486
-0.194
-0.45%
jan 1, 1974
42.286
-0.2
-0.47%
jan 1, 1975
42.04
-0.246
-0.58%
jan 1, 1976
41.734
-0.306
-0.73%
jan 1, 1977
41.476
-0.259
-0.62%
jan 1, 1978
41.163
-0.312
-0.75%
jan 1, 1979
40.817
-0.346
-0.84%
jan 1, 1980
40.466
-0.351
-0.86%
jan 1, 1981
40.125
-0.341
-0.84%
jan 1, 1982
39.833
-0.292
-0.73%
jan 1, 1983
39.534
-0.299
-0.75%
jan 1, 1984
39.229
-0.305
-0.77%
jan 1, 1985
38.911
-0.318
-0.81%
jan 1, 1986
38.573
-0.338
-0.87%
jan 1, 1987
38.234
-0.339
-0.88%
jan 1, 1988
37.875
-0.358
-0.94%
jan 1, 1989
37.498
-0.377
-0.99%
jan 1, 1990
37.104
-0.395
-1.05%
jan 1, 1991
36.692
-0.412
-1.11%
jan 1, 1992
36.272
-0.42
-1.14%
jan 1, 1993
35.837
-0.436
-1.2%
jan 1, 1994
35.388
-0.449
-1.25%
jan 1, 1995
34.931
-0.456
-1.29%
jan 1, 1996
34.473
-0.458
-1.31%
jan 1, 1997
34.024
-0.45
-1.3%
jan 1, 1998
33.584
-0.439
-1.29%
jan 1, 1999
33.15
-0.435
-1.29%
jan 1, 2000
32.713
-0.437
-1.32%
jan 1, 2001
32.272
-0.441
-1.35%
jan 1, 2002
31.864
-0.408
-1.26%
jan 1, 2003
31.447
-0.417
-1.31%
jan 1, 2004
31.027
-0.42
-1.34%
jan 1, 2005
30.611
-0.416
-1.34%
jan 1, 2006
30.199
-0.412
-1.35%
jan 1, 2007
29.777
-0.422
-1.4%
jan 1, 2008
29.347
-0.43
-1.45%
jan 1, 2009
28.911
-0.435
-1.48%
jan 1, 2010
28.478
-0.434
-1.5%
jan 1, 2011
28.051
-0.427
-1.5%
jan 1, 2012
27.605
-0.446
-1.59%
jan 1, 2013
27.193
-0.412
-1.49%
jan 1, 2014
26.797
-0.395
-1.45%
jan 1, 2015
26.396
-0.401
-1.5%
jan 1, 2016
25.981
-0.415
-1.57%
Ranking of countries by current statistics by years


Comments: