29
/
en
AIzaSyAYiBZKx7MnpbEhh9jyipgxe19OcubqV5w
April 1, 2024
66494
Algeria
DZA
true
2
1
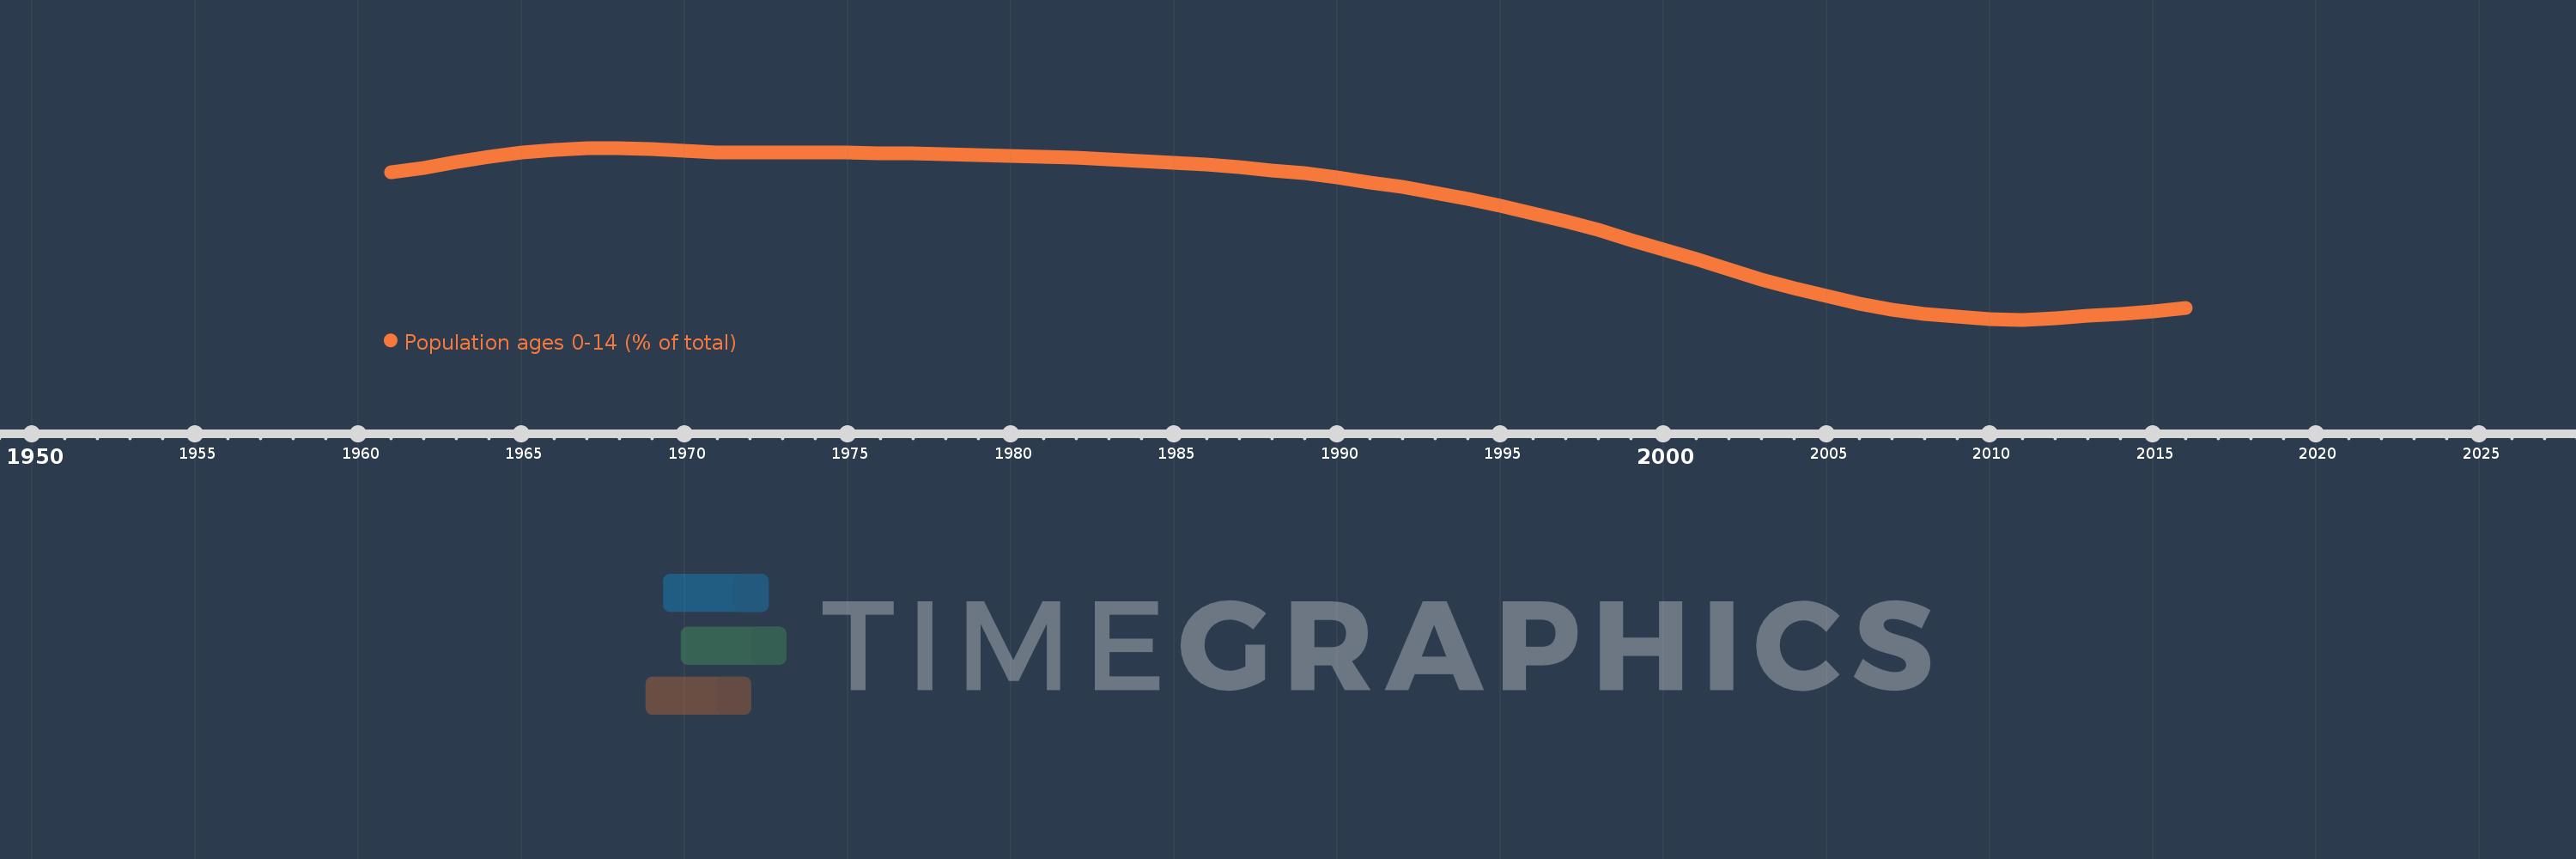
Population ages 0-14 (% of total)
2016,2015,2014,2013,2012,2011,2010,2009,2008,2007,2006,2005,2004,2003,2002,2001,2000,1999,1998,1997,1996,1995,1994,1993,1992,1991,1990,1989,1988,1987,1986,1985,1984,1983,1982,1981,1980,1979,1978,1977,1976,1975,1974,1973,1972,1971,1970,1969,1968,1967,1966,1965,1964,1963,1962,1961
This statistics in other country:
AfghanistanAlbaniaAlgeriaAngolaAntigua and BarbudaArab WorldArgentinaArmeniaArubaAustraliaAustriaAzerbaijanBahamas, TheBahrainBangladeshBarbadosBelarusBelgiumBelizeBeninBhutanBoliviaBosnia and HerzegovinaBotswanaBrazilBrunei DarussalamBulgariaBurkina FasoBurundiCabo VerdeCambodiaCameroonCanadaCaribbean small statesCentral African RepublicCentral Europe and the BalticsChadChannel IslandsChileChinaColombiaComorosCongo, Dem. Rep.Congo, Rep.Costa RicaCote d'IvoireCroatiaCubaCuracaoCyprusCzech RepublicDenmarkDjiboutiDominican RepublicEarly-demographic dividendEast Asia & PacificEast Asia & Pacific (excluding high income)East Asia & Pacific (IDA & IBRD countries)EcuadorEgypt, Arab Rep.El SalvadorEquatorial GuineaEritreaEstoniaEthiopiaEuro areaEurope & Central AsiaEurope & Central Asia (excluding high income)Europe & Central Asia (IDA & IBRD countries)European UnionFijiFinlandFragile and conflict affected situationsFranceFrench PolynesiaGabonGambia, TheGeorgiaGermanyGhanaGreeceGrenadaGuamGuatemalaGuineaGuinea-BissauGuyanaHaitiHeavily indebted poor countries (HIPC)High incomeHondurasHong Kong SAR, ChinaHungaryIBRD onlyIcelandIDA & IBRD totalIDA blendIDA onlyIDA totalIndiaIndonesiaIran, Islamic Rep.IraqIrelandIsraelItalyJamaicaJapanJordanKazakhstanKenyaKiribatiKorea, Dem. People’s Rep.Korea, Rep.KosovoKuwaitKyrgyz RepublicLao PDRLate-demographic dividendLatin America & Caribbean Latin America & Caribbean (excluding high income)Latin America & the Caribbean (IDA & IBRD countries)LatviaLeast developed countries: UN classificationLebanonLesothoLiberiaLibyaLithuaniaLow & middle incomeLow incomeLower middle incomeLuxembourgMacao SAR, ChinaMacedonia, FYRMadagascarMalawiMalaysiaMaldivesMaliMaltaMauritaniaMauritiusMexicoMicronesia, Fed. Sts.Middle East & North AfricaMiddle East & North Africa (excluding high income)Middle East & North Africa (IDA & IBRD countries)Middle incomeMoldovaMongoliaMontenegroMoroccoMozambiqueMyanmarNamibiaNepalNetherlandsNew CaledoniaNew ZealandNicaraguaNigerNigeriaNorth AmericaNorwayOECD membersOmanOther small statesPacific island small statesPakistanPanamaPapua New GuineaParaguayPeruPhilippinesPolandPortugalPost-demographic dividendPre-demographic dividendPuerto RicoQatarRomaniaRussian FederationRwandaSamoaSao Tome and PrincipeSaudi ArabiaSenegalSerbiaSeychellesSierra LeoneSingaporeSlovak RepublicSloveniaSmall statesSolomon IslandsSomaliaSouth AfricaSouth AsiaSouth Asia (IDA & IBRD)South SudanSpainSri LankaSt. LuciaSt. Vincent and the GrenadinesSub-Saharan Africa Sub-Saharan Africa (excluding high income)Sub-Saharan Africa (IDA & IBRD countries)SudanSurinameSwazilandSwedenSwitzerlandSyrian Arab RepublicTajikistanTanzaniaThailandTimor-LesteTogoTongaTrinidad and TobagoTunisiaTurkeyTurkmenistanUgandaUkraineUnited Arab EmiratesUnited KingdomUnited StatesUpper middle incomeUruguayUzbekistanVanuatuVenezuela, RBVietnamVirgin Islands (U.S.)West Bank and GazaWorldYemen, Rep.ZambiaZimbabwe Timeline:
This timeline shows a graph from 1961 to 2016 of Algeria. No data until 1960. Number of actual observations by date: 56.
Source name:
World Development Indicators
Source organization:
World Bank staff estimates based on age distributions of United Nations Population Division's World Population Prospects.
Categories, topics:
Education, Health
Last updated:
apr 23, 2017
Indicators value changes by year
Minimum:
27.191
jan 1, 2011
Maximum:
47.357
jan 1, 1968
At the date of observation
Value
Absolute change
Change from previous value
jan 1, 1961
44.539
+44.539
0.0%
jan 1, 1962
45.039
+0.5
1.12%
jan 1, 1963
45.674
+0.635
1.41%
jan 1, 1964
46.322
+0.649
1.42%
jan 1, 1965
46.815
+0.493
1.06%
jan 1, 1966
47.084
+0.269
0.57%
jan 1, 1967
47.349
+0.265
0.56%
jan 1, 1968
47.357
+0.007
0.02%
jan 1, 1969
47.2
-0.157
-0.33%
jan 1, 1970
47.012
-0.188
-0.4%
jan 1, 1971
46.859
-0.153
-0.33%
jan 1, 1972
46.844
-0.015
-0.03%
jan 1, 1973
46.85
+0.006
0.01%
jan 1, 1974
46.856
+0.007
0.01%
jan 1, 1975
46.822
-0.034
-0.07%
jan 1, 1976
46.73
-0.092
-0.2%
jan 1, 1977
46.736
+0.006
0.01%
jan 1, 1978
46.668
-0.068
-0.15%
jan 1, 1979
46.549
-0.118
-0.25%
jan 1, 1980
46.412
-0.137
-0.29%
jan 1, 1981
46.272
-0.14
-0.3%
jan 1, 1982
46.183
-0.089
-0.19%
jan 1, 1983
46.043
-0.14
-0.3%
jan 1, 1984
45.861
-0.182
-0.4%
jan 1, 1985
45.636
-0.225
-0.49%
jan 1, 1986
45.363
-0.273
-0.6%
jan 1, 1987
45.089
-0.274
-0.6%
jan 1, 1988
44.753
-0.336
-0.75%
jan 1, 1989
44.353
-0.4
-0.89%
jan 1, 1990
43.883
-0.47
-1.06%
jan 1, 1991
43.338
-0.545
-1.24%
jan 1, 1992
42.767
-0.571
-1.32%
jan 1, 1993
42.127
-0.64
-1.5%
jan 1, 1994
41.41
-0.717
-1.7%
jan 1, 1995
40.603
-0.807
-1.95%
jan 1, 1996
39.696
-0.906
-2.23%
jan 1, 1997
38.751
-0.945
-2.38%
jan 1, 1998
37.698
-1.053
-2.72%
jan 1, 1999
36.568
-1.13
-3.0%
jan 1, 2000
35.414
-1.154
-3.16%
jan 1, 2001
34.272
-1.141
-3.22%
jan 1, 2002
33.068
-1.205
-3.52%
jan 1, 2003
31.946
-1.122
-3.39%
jan 1, 2004
30.901
-1.045
-3.27%
jan 1, 2005
29.935
-0.966
-3.13%
jan 1, 2006
29.073
-0.862
-2.88%
jan 1, 2007
28.399
-0.674
-2.32%
jan 1, 2008
27.882
-0.518
-1.82%
jan 1, 2009
27.514
-0.368
-1.32%
jan 1, 2010
27.286
-0.228
-0.83%
jan 1, 2011
27.191
-0.095
-0.35%
jan 1, 2012
27.395
+0.204
0.75%
jan 1, 2013
27.62
+0.225
0.82%
jan 1, 2014
27.89
+0.27
0.98%
jan 1, 2015
28.206
+0.316
1.13%
jan 1, 2016
28.539
+0.333
1.18%
Ranking of countries by current statistics by years


Comments: